
Germany - Decaffeinated Coffee - Market Analysis, Forecast, Size, Trends And Insights
Get instant access to more than 2 million reports, dashboards, and datasets on the IndexBox Platform.
View PricingGermany's September 2023 Decaf Coffee Exports Plummet by 19% to $54M
Germany Decaffeinated Coffee Exports
In September 2023, the amount of decaffeinated coffee exported from Germany fell sharply to 11K tons, which is down by -16.9% compared with the month before. Over the period under review, exports showed a mild curtailment. The pace of growth was the most pronounced in December 2022 when exports increased by 110% m-o-m.
In value terms, decaffeinated coffee exports shrank significantly to $54M (IndexBox estimates) in September 2023. In general, exports recorded a slight decrease. The most prominent rate of growth was recorded in December 2022 when exports increased by 68% month-to-month.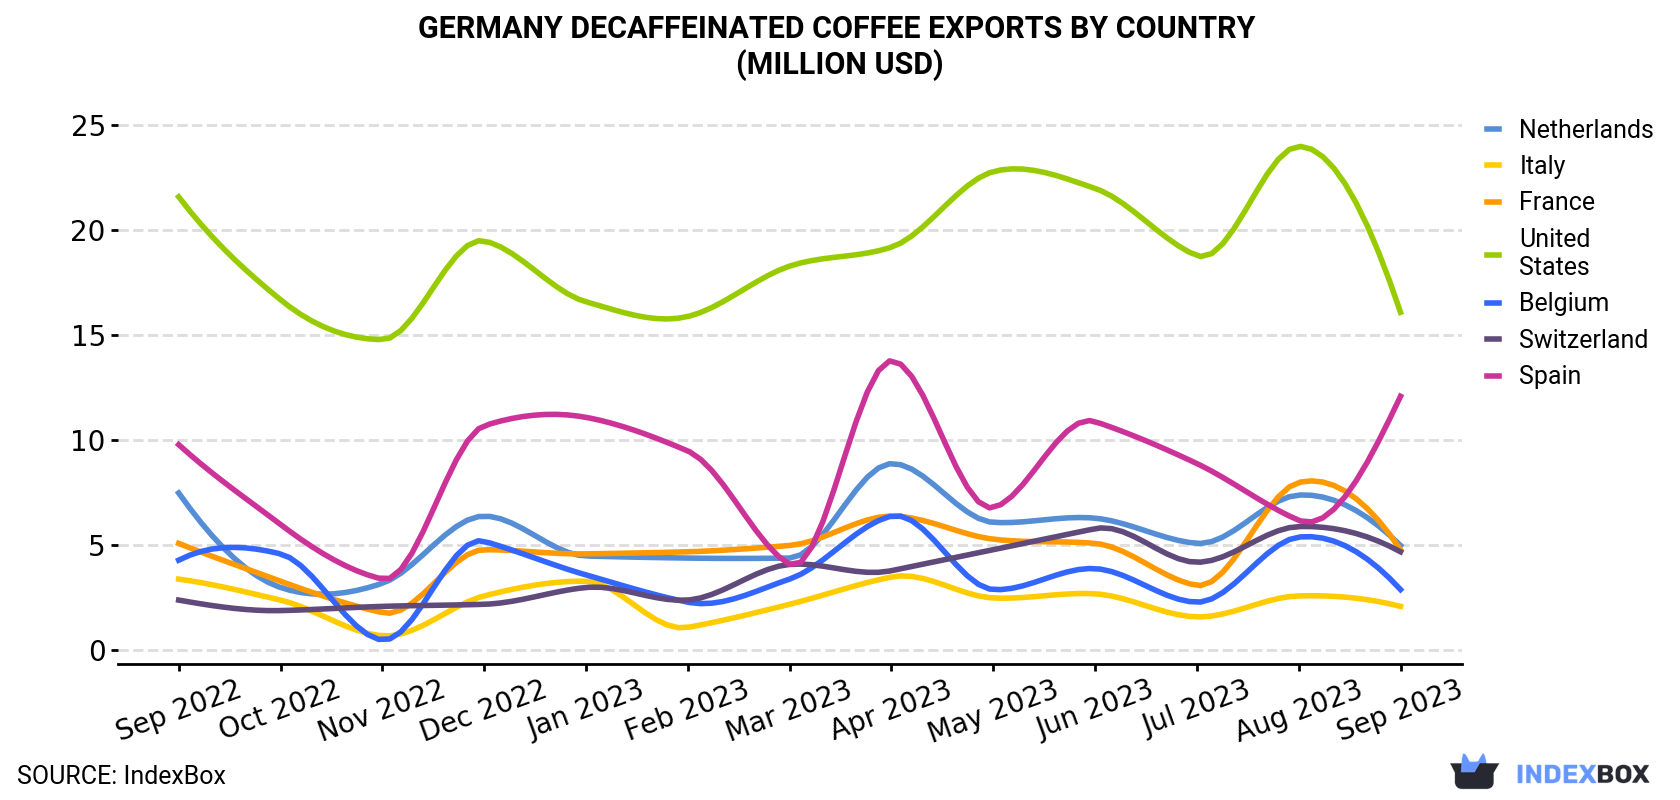
| COUNTRY | Export Value of Decaffeinated Coffee in Germany (million USD) | ||||||||||||
|---|---|---|---|---|---|---|---|---|---|---|---|---|---|
| Sep 2022 | Oct 2022 | Nov 2022 | Dec 2022 | Jan 2023 | Feb 2023 | Mar 2023 | Apr 2023 | May 2023 | Jun 2023 | Jul 2023 | Aug 2023 | Sep 2023 | |
| United States | 21.6 | 16.7 | 14.8 | 19.5 | 16.6 | 15.9 | 18.3 | 19.2 | 22.8 | 22.0 | 18.8 | 24.0 | 16.1 |
| Spain | 9.8 | 6.0 | 3.4 | 10.7 | 11.1 | 9.5 | 4.1 | 13.8 | 6.8 | 10.9 | 8.9 | 6.2 | 12.1 |
| Netherlands | 7.5 | 3.0 | 3.2 | 6.4 | 4.5 | 4.4 | 4.4 | 8.9 | 6.1 | 6.3 | 5.1 | 7.4 | 5.0 |
| France | 5.1 | 3.3 | 1.8 | 4.8 | 4.6 | 4.7 | 5.0 | 6.4 | 5.3 | 5.1 | 3.1 | 8.0 | 4.8 |
| Switzerland | 2.4 | 1.9 | 2.1 | 2.2 | 3.0 | 2.4 | 4.1 | 3.8 | 4.8 | 5.8 | 4.2 | 5.9 | 4.7 |
| Belgium | 4.3 | 4.6 | 0.5 | 5.2 | 3.6 | 2.3 | 3.4 | 6.4 | 2.9 | 3.9 | 2.3 | 5.4 | 2.9 |
| Italy | 3.4 | 2.4 | 0.7 | 2.6 | 3.3 | 1.1 | 2.2 | 3.5 | 2.5 | 2.7 | 1.6 | 2.6 | 2.1 |
| Others | 6.7 | 5.5 | 6.9 | 4.7 | 6.7 | 5.9 | 7.4 | 8.0 | 7.6 | 6.9 | 6.2 | 7.2 | 6.1 |
| Total | 60.6 | 43.4 | 33.4 | 56.1 | 53.6 | 46.3 | 48.8 | 70.0 | 58.8 | 63.5 | 50.2 | 66.7 | 53.9 |
Exports by Country
Spain (3.2K tons), the United States (3.1K tons) and the Netherlands (1.1K tons) were the main destinations of decaffeinated coffee exports from Germany, together comprising 67% of total exports. These countries were followed by Switzerland, France, Belgium and Italy, which together accounted for a further 24%.
From September 2022 to September 2023, the most notable rate of growth in terms of shipments, amongst the main countries of destination, was attained by Switzerland (with a CAGR of +7.0%), while the other leaders experienced mixed trend patterns.
In value terms, the largest markets for decaffeinated coffee exported from Germany were the United States ($16M), Spain ($12M) and the Netherlands ($5M), together accounting for 62% of total exports. France, Switzerland, Belgium and Italy lagged somewhat behind, together comprising a further 27%.
Switzerland, with a CAGR of +5.9%, saw the highest rates of growth with regard to the value of exports, in terms of the main countries of destination over the period under review, while shipments for the other leaders experienced mixed trend patterns.
Exports by Type
Unroasted decaffeinated coffee (11K tons) was the largest type of decaffeinated coffee exported from Germany, accounting for a 95% share of total exports. Moreover, unroasted decaffeinated coffee exceeded the volume of the second product type, roasted decaffeinated coffee (525 tons), more than tenfold.
From September 2022 to September 2023, the average monthly rate of growth in terms of the volume of export of unroasted decaffeinated coffee was relatively modest.
In value terms, unroasted decaffeinated coffee ($49M) remains the largest type of decaffeinated coffee exported from Germany, comprising 91% of total exports. The second position in the ranking was held by roasted decaffeinated coffee ($4.7M), with an 8.7% share of total exports.
From September 2022 to September 2023, the average monthly rate of growth in terms of the export volume of unroasted decaffeinated coffee stood at -1.1%.
Export Prices by Country
In September 2023, the decaffeinated coffee price amounted to $4,846 per ton (FOB, Germany), dropping by -2.7% against the previous month. In general, the export price, however, showed a relatively flat trend pattern. The most prominent rate of growth was recorded in November 2022 an increase of 22% m-o-m. As a result, the export price attained the peak level of $5,676 per ton. From December 2022 to September 2023, the the average export prices remained at a lower figure.
There were significant differences in the average prices for the major export markets. In September 2023, the country with the highest price was France ($6,573 per ton), while the average price for exports to Bulgaria ($3,007 per ton) was amongst the lowest.
From September 2022 to September 2023, the most notable rate of growth in terms of prices was recorded for supplies to Bulgaria (+2.3%), while the prices for the other major destinations experienced more modest paces of growth.
This report provides an in-depth analysis of the decaffeinated coffee market in Germany. Within it, you will discover the latest data on market trends and opportunities by country, consumption, production and price developments, as well as the global trade (imports and exports). The forecast exhibits the market prospects through 2030.
Product coverage:
- Prodcom 10831130 - Decaffeinated coffee, not roasted
- Prodcom 10831170 - Roasted decaffeinated coffee
Country coverage:
- Germany
Data coverage:
- Market volume and value
- Per Capita consumption
- Forecast of the market dynamics in the medium term
- Trade (exports and imports) in Germany
- Export and import prices
- Market trends, drivers and restraints
- Key market players and their profiles
Reasons to buy this report:
- Take advantage of the latest data
- Find deeper insights into current market developments
- Discover vital success factors affecting the market
This report is designed for manufacturers, distributors, importers, and wholesalers, as well as for investors, consultants and advisors.
In this report, you can find information that helps you to make informed decisions on the following issues:
- How to diversify your business and benefit from new market opportunities
- How to load your idle production capacity
- How to boost your sales on overseas markets
- How to increase your profit margins
- How to make your supply chain more sustainable
- How to reduce your production and supply chain costs
- How to outsource production to other countries
- How to prepare your business for global expansion
While doing this research, we combine the accumulated expertise of our analysts and the capabilities of artificial intelligence. The AI-based platform, developed by our data scientists, constitutes the key working tool for business analysts, empowering them to discover deep insights and ideas from the marketing data.
-
1. INTRODUCTION
Making Data-Driven Decisions to Grow Your Business
- REPORT DESCRIPTION
- RESEARCH METHODOLOGY AND AI PLATFORM
- DATA-DRIVEN DECISIONS FOR YOUR BUSINESS
- GLOSSARY AND SPECIFIC TERMS
-
2. EXECUTIVE SUMMARY
A Quick Overview of Market Performance
- KEY FINDINGS
- MARKET TRENDS This Chapter is Available Only for the Professional Edition PRO
-
3. MARKET OVERVIEW
Understanding the Current State of The Market and Its Prospects
- MARKET SIZE
- MARKET STRUCTURE
- TRADE BALANCE
- PER CAPITA CONSUMPTION
- MARKET FORECAST TO 2030
-
4. MOST PROMISING PRODUCT
Finding New Products to Diversify Your Business
This Chapter is Available Only for the Professional Edition PRO- TOP PRODUCTS TO DIVERSIFY YOUR BUSINESS
- BEST-SELLING PRODUCTS
- MOST CONSUMED PRODUCT
- MOST TRADED PRODUCT
- MOST PROFITABLE PRODUCT FOR EXPORT
-
5. MOST PROMISING SUPPLYING COUNTRIES
Choosing the Best Countries to Establish Your Sustainable Supply Chain
This Chapter is Available Only for the Professional Edition PRO- TOP COUNTRIES TO SOURCE YOUR PRODUCT
- TOP PRODUCING COUNTRIES
- TOP EXPORTING COUNTRIES
- LOW-COST EXPORTING COUNTRIES
-
6. MOST PROMISING OVERSEAS MARKETS
Choosing the Best Countries to Boost Your Exports
This Chapter is Available Only for the Professional Edition PRO- TOP OVERSEAS MARKETS FOR EXPORTING YOUR PRODUCT
- TOP CONSUMING MARKETS
- UNSATURATED MARKETS
- TOP IMPORTING MARKETS
- MOST PROFITABLE MARKETS
7. PRODUCTION
The Latest Trends and Insights into The Industry
- PRODUCTION VOLUME AND VALUE
8. IMPORTS
The Largest Import Supplying Countries
- IMPORTS FROM 2012–2023
- IMPORTS BY COUNTRY
- IMPORT PRICES BY COUNTRY
9. EXPORTS
The Largest Destinations for Exports
- EXPORTS FROM 2012–2023
- EXPORTS BY COUNTRY
- EXPORT PRICES BY COUNTRY
-
10. PROFILES OF MAJOR PRODUCERS
The Largest Producers on The Market and Their Profiles
This Chapter is Available Only for the Professional Edition PRO -
LIST OF TABLES
- Key Findings In 2023
- Market Volume, In Physical Terms, 2012–2023
- Market Value, 2012–2023
- Per Capita Consumption In 2012-2023
- Imports, In Physical Terms, By Country, 2012–2023
- Imports, In Value Terms, By Country, 2012–2023
- Import Prices, By Country Of Origin, 2012–2023
- Exports, In Physical Terms, By Country, 2012–2023
- Exports, In Value Terms, By Country, 2012–2023
- Export Prices, By Country Of Destination, 2012–2023
-
LIST OF FIGURES
- Market Volume, In Physical Terms, 2012–2023
- Market Value, 2012–2023
- Market Structure – Domestic Supply vs. Imports, In Physical Terms, 2012-2023
- Market Structure – Domestic Supply vs. Imports, In Value Terms, 2012-2023
- Trade Balance, In Physical Terms, 2012-2023
- Trade Balance, In Value Terms, 2012-2023
- Per Capita Consumption, 2012-2023
- Market Volume Forecast to 2030
- Market Value Forecast to 2030
- Products: Market Size And Growth, By Type
- Products: Average Per Capita Consumption, By Type
- Products: Exports And Growth, By Type
- Products: Export Prices And Growth, By Type
- Production Volume And Growth
- Exports And Growth
- Export Prices And Growth
- Market Size And Growth
- Per Capita Consumption
- Imports And Growth
- Import Prices
- Production, In Physical Terms, 2012–2023
- Production, In Value Terms, 2012–2023
- Imports, In Physical Terms, 2012–2023
- Imports, In Value Terms, 2012–2023
- Imports, In Physical Terms, By Country, 2023
- Imports, In Physical Terms, By Country, 2012–2023
- Imports, In Value Terms, By Country, 2012–2023
- Import Prices, By Country Of Origin, 2012–2023
- Exports, In Physical Terms, 2012–2023
- Exports, In Value Terms, 2012–2023
- Exports, In Physical Terms, By Country, 2023
- Exports, In Physical Terms, By Country, 2012–2023
- Exports, In Value Terms, By Country, 2012–2023
- Export Prices, By Country Of Destination, 2012–2023


