
Turkey - Sheep or Lamb Skin Leather - Market Analysis, Forecast, Size, Trends And Insights
Get instant access to more than 2 million reports, dashboards, and datasets on the IndexBox Platform.
View PricingTurkeys Import of Sheep Leather Decreases Significantly to $241K in January 2024
Turkey Sheep Leather Imports
In January 2024, after two months of decline, there was significant growth in overseas purchases of sheep or lamb skin leather, when their volume increased by 52% to 80K square meters. In general, imports, however, continue to indicate a deep slump. The most prominent rate of growth was recorded in October 2023 with an increase of 132% m-o-m. Over the period under review, imports reached the peak figure at 248K square meters in February 2023; however, from March 2023 to January 2024, imports stood at a somewhat lower figure.
In value terms, sheep leather imports shrank to $241K (IndexBox estimates) in January 2024. Overall, imports, however, recorded a deep setback. The most prominent rate of growth was recorded in March 2023 with an increase of 207% month-to-month. As a result, imports reached the peak of $1.8M. From April 2023 to January 2024, the growth of imports remained at a somewhat lower figure.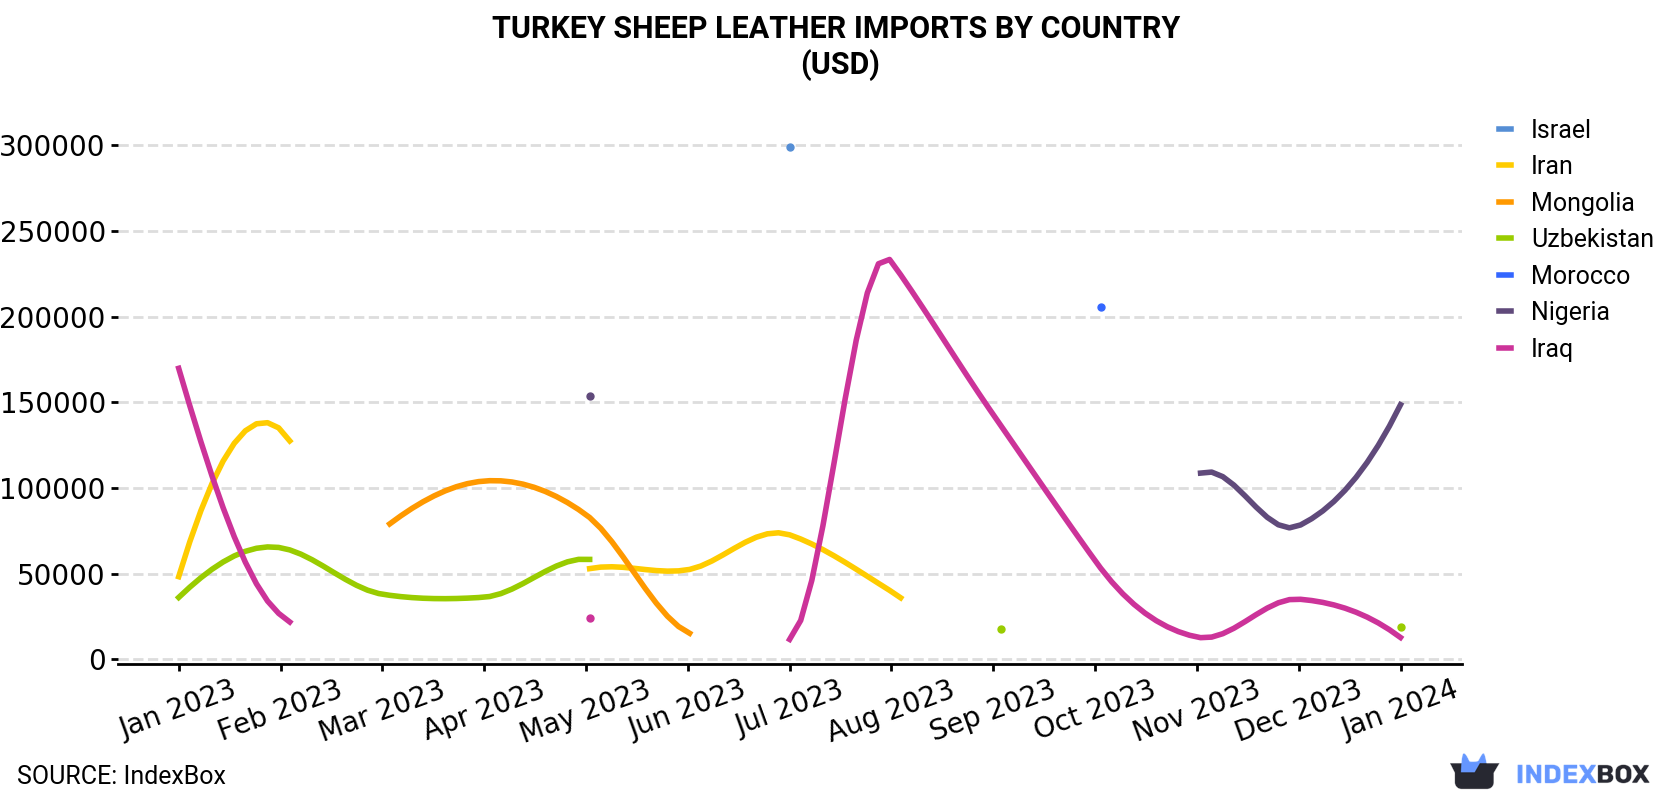
| COUNTRY | Import Value of Sheep Leather in Turkey (USD) | ||||||||||||
|---|---|---|---|---|---|---|---|---|---|---|---|---|---|
| Jan 2023 | Feb 2023 | Mar 2023 | Apr 2023 | May 2023 | Jun 2023 | Jul 2023 | Aug 2023 | Sep 2023 | Oct 2023 | Nov 2023 | Dec 2023 | Jan 2024 | |
| Nigeria | N/A | N/A | N/A | N/A | 153,900 | N/A | N/A | N/A | N/A | N/A | 107,587 | 77,883 | 148,566 |
| Uzbekistan | 36,110 | 65,143 | 38,000 | 36,270 | 58,580 | N/A | N/A | N/A | 17,700 | N/A | N/A | N/A | 18,700 |
| Iraq | 169,795 | 25,920 | N/A | N/A | 24,300 | N/A | 11,650 | 232,050 | 142,800 | 57,625 | 13,000 | 35,125 | 12,750 |
| Israel | N/A | N/A | N/A | N/A | N/A | N/A | 298,800 | N/A | N/A | N/A | N/A | N/A | N/A |
| Iran | 48,250 | 134,200 | N/A | N/A | 52,458 | 52,260 | 72,666 | 39,600 | N/A | N/A | N/A | N/A | N/A |
| Mongolia | N/A | N/A | 75,712 | 104,055 | 84,430 | 15,750 | N/A | N/A | N/A | N/A | N/A | N/A | N/A |
| Morocco | N/A | N/A | N/A | N/A | N/A | N/A | N/A | N/A | N/A | 205,475 | N/A | N/A | N/A |
| Others | 422,929 | 372,783 | 1,723,653 | 748,219 | 110,522 | 344,499 | 581,687 | 213,795 | 247,162 | 449,292 | 197,420 | 155,885 | 60,661 |
| Total | 677,084 | 598,046 | 1,837,365 | 888,544 | 484,190 | 412,509 | 964,803 | 485,445 | 407,662 | 712,392 | 318,007 | 268,893 | 240,677 |
Imports by Country
Nigeria (26K square meters), Iraq (16K square meters) and Uzbekistan (15K square meters) were the main suppliers of sheep leather imports to Turkey, together comprising 71% of total imports.
From January 2023 to January 2024, the most notable rate of growth in terms of purchases, amongst the main suppliers, was attained by Nigeria (with a CAGR of +8.9%), while imports for the other leaders experienced a decline.
In value terms, Nigeria ($149K) constituted the largest supplier of sheep leather to Turkey, comprising 62% of total imports. The second position in the ranking was taken by Uzbekistan ($19K), with a 7.8% share of total imports.
From January 2023 to January 2024, the average monthly rate of growth in terms of value from Nigeria was relatively modest. The remaining supplying countries recorded the following average monthly rates of imports growth: Uzbekistan (-5.3% per month) and Iraq (-19.4% per month).
Import Prices by Country
In January 2024, the sheep leather price amounted to $3.0 per square meter (CIF, Turkey), with a decrease of -41.1% against the previous month. Overall, the import price showed a slight decline. The growth pace was the most rapid in March 2023 when the average import price increased by 223% against the previous month. Over the period under review, average import prices attained the peak figure at $7.9 per square meter in September 2023; however, from October 2023 to January 2024, import prices stood at a somewhat lower figure.
There were significant differences in the average prices amongst the major supplying countries. In January 2024, the country with the highest price was Sudan ($12.7 per square meter), while the price for Iraq ($817 per thousand square meters) was amongst the lowest.
From January 2023 to January 2024, the most notable rate of growth in terms of prices was attained by Sudan (+4.4%), while the prices for the other major suppliers experienced more modest paces of growth.
This report provides an in-depth analysis of the sheep leather market in Turkey. Within it, you will discover the latest data on market trends and opportunities by country, consumption, production and price developments, as well as the global trade (imports and exports). The forecast exhibits the market prospects through 2030.
Product coverage:
- Prodcom 15114130 - Sheep or lamb skin leather without wool on, tanned but not further prepared (excluding chamois leather)
Country coverage:
- Turkey
Data coverage:
- Market volume and value
- Per Capita consumption
- Forecast of the market dynamics in the medium term
- Trade (exports and imports) in Turkey
- Export and import prices
- Market trends, drivers and restraints
- Key market players and their profiles
Reasons to buy this report:
- Take advantage of the latest data
- Find deeper insights into current market developments
- Discover vital success factors affecting the market
This report is designed for manufacturers, distributors, importers, and wholesalers, as well as for investors, consultants and advisors.
In this report, you can find information that helps you to make informed decisions on the following issues:
- How to diversify your business and benefit from new market opportunities
- How to load your idle production capacity
- How to boost your sales on overseas markets
- How to increase your profit margins
- How to make your supply chain more sustainable
- How to reduce your production and supply chain costs
- How to outsource production to other countries
- How to prepare your business for global expansion
While doing this research, we combine the accumulated expertise of our analysts and the capabilities of artificial intelligence. The AI-based platform, developed by our data scientists, constitutes the key working tool for business analysts, empowering them to discover deep insights and ideas from the marketing data.
-
1. INTRODUCTION
Making Data-Driven Decisions to Grow Your Business
- REPORT DESCRIPTION
- RESEARCH METHODOLOGY AND AI PLATFORM
- DATA-DRIVEN DECISIONS FOR YOUR BUSINESS
- GLOSSARY AND SPECIFIC TERMS
-
2. EXECUTIVE SUMMARY
A Quick Overview of Market Performance
- KEY FINDINGS
- MARKET TRENDS This Chapter is Available Only for the Professional Edition PRO
-
3. MARKET OVERVIEW
Understanding the Current State of The Market and Its Prospects
- MARKET SIZE
- MARKET STRUCTURE
- TRADE BALANCE
- PER CAPITA CONSUMPTION
- MARKET FORECAST TO 2030
-
4. MOST PROMISING PRODUCT
Finding New Products to Diversify Your Business
This Chapter is Available Only for the Professional Edition PRO- TOP PRODUCTS TO DIVERSIFY YOUR BUSINESS
- BEST-SELLING PRODUCTS
- MOST CONSUMED PRODUCT
- MOST TRADED PRODUCT
- MOST PROFITABLE PRODUCT FOR EXPORT
-
5. MOST PROMISING SUPPLYING COUNTRIES
Choosing the Best Countries to Establish Your Sustainable Supply Chain
This Chapter is Available Only for the Professional Edition PRO- TOP COUNTRIES TO SOURCE YOUR PRODUCT
- TOP PRODUCING COUNTRIES
- TOP EXPORTING COUNTRIES
- LOW-COST EXPORTING COUNTRIES
-
6. MOST PROMISING OVERSEAS MARKETS
Choosing the Best Countries to Boost Your Exports
This Chapter is Available Only for the Professional Edition PRO- TOP OVERSEAS MARKETS FOR EXPORTING YOUR PRODUCT
- TOP CONSUMING MARKETS
- UNSATURATED MARKETS
- TOP IMPORTING MARKETS
- MOST PROFITABLE MARKETS
7. PRODUCTION
The Latest Trends and Insights into The Industry
- PRODUCTION VOLUME AND VALUE
8. IMPORTS
The Largest Import Supplying Countries
- IMPORTS FROM 2012–2023
- IMPORTS BY COUNTRY
- IMPORT PRICES BY COUNTRY
9. EXPORTS
The Largest Destinations for Exports
- EXPORTS FROM 2012–2023
- EXPORTS BY COUNTRY
- EXPORT PRICES BY COUNTRY
-
10. PROFILES OF MAJOR PRODUCERS
The Largest Producers on The Market and Their Profiles
This Chapter is Available Only for the Professional Edition PRO -
LIST OF TABLES
- Key Findings In 2023
- Market Volume, In Physical Terms, 2012–2023
- Market Value, 2012–2023
- Per Capita Consumption In 2012-2023
- Imports, In Physical Terms, By Country, 2012–2023
- Imports, In Value Terms, By Country, 2012–2023
- Import Prices, By Country Of Origin, 2012–2023
- Exports, In Physical Terms, By Country, 2012–2023
- Exports, In Value Terms, By Country, 2012–2023
- Export Prices, By Country Of Destination, 2012–2023
-
LIST OF FIGURES
- Market Volume, In Physical Terms, 2012–2023
- Market Value, 2012–2023
- Market Structure – Domestic Supply vs. Imports, In Physical Terms, 2012-2023
- Market Structure – Domestic Supply vs. Imports, In Value Terms, 2012-2023
- Trade Balance, In Physical Terms, 2012-2023
- Trade Balance, In Value Terms, 2012-2023
- Per Capita Consumption, 2012-2023
- Market Volume Forecast to 2030
- Market Value Forecast to 2030
- Products: Market Size And Growth, By Type
- Products: Average Per Capita Consumption, By Type
- Products: Exports And Growth, By Type
- Products: Export Prices And Growth, By Type
- Production Volume And Growth
- Exports And Growth
- Export Prices And Growth
- Market Size And Growth
- Per Capita Consumption
- Imports And Growth
- Import Prices
- Production, In Physical Terms, 2012–2023
- Production, In Value Terms, 2012–2023
- Imports, In Physical Terms, 2012–2023
- Imports, In Value Terms, 2012–2023
- Imports, In Physical Terms, By Country, 2023
- Imports, In Physical Terms, By Country, 2012–2023
- Imports, In Value Terms, By Country, 2012–2023
- Import Prices, By Country Of Origin, 2012–2023
- Exports, In Physical Terms, 2012–2023
- Exports, In Value Terms, 2012–2023
- Exports, In Physical Terms, By Country, 2023
- Exports, In Physical Terms, By Country, 2012–2023
- Exports, In Value Terms, By Country, 2012–2023
- Export Prices, By Country Of Destination, 2012–2023


