World - Sunflower Seed - Market Analysis, Forecast, Size, Trends and Insights
Get instant access to more than 2 million reports, dashboards, and datasets on the IndexBox Platform.
View PricingGlobal Sunflower Seed Market to Reach 73M Tons by 2030 with 3.8% CAGR Growth
IndexBox has just published a new report: World - Sunflower Seed - Market Analysis, Forecast, Size, Trends and Insights.
Driven by increasing demand for sunflower seed worldwide, the market is expected to see growth in volume and value over the next seven years. In 2023, consumption expanded slightly to 56M tons, with the biggest consuming countries being Russia, Ukraine, and Argentina. Production and export prices also saw fluctuations, with global imports declining in 2023. Romania, Bulgaria, and China were the main exporters of sunflower seed in 2023.
Market Forecast
Driven by increasing demand for sunflower seed worldwide, the market is expected to continue an upward consumption trend over the next seven-year period. Market performance is forecast to accelerate, expanding with an anticipated CAGR of +3.8% for the period from 2023 to 2030, which is projected to bring the market volume to 73M tons by the end of 2030.
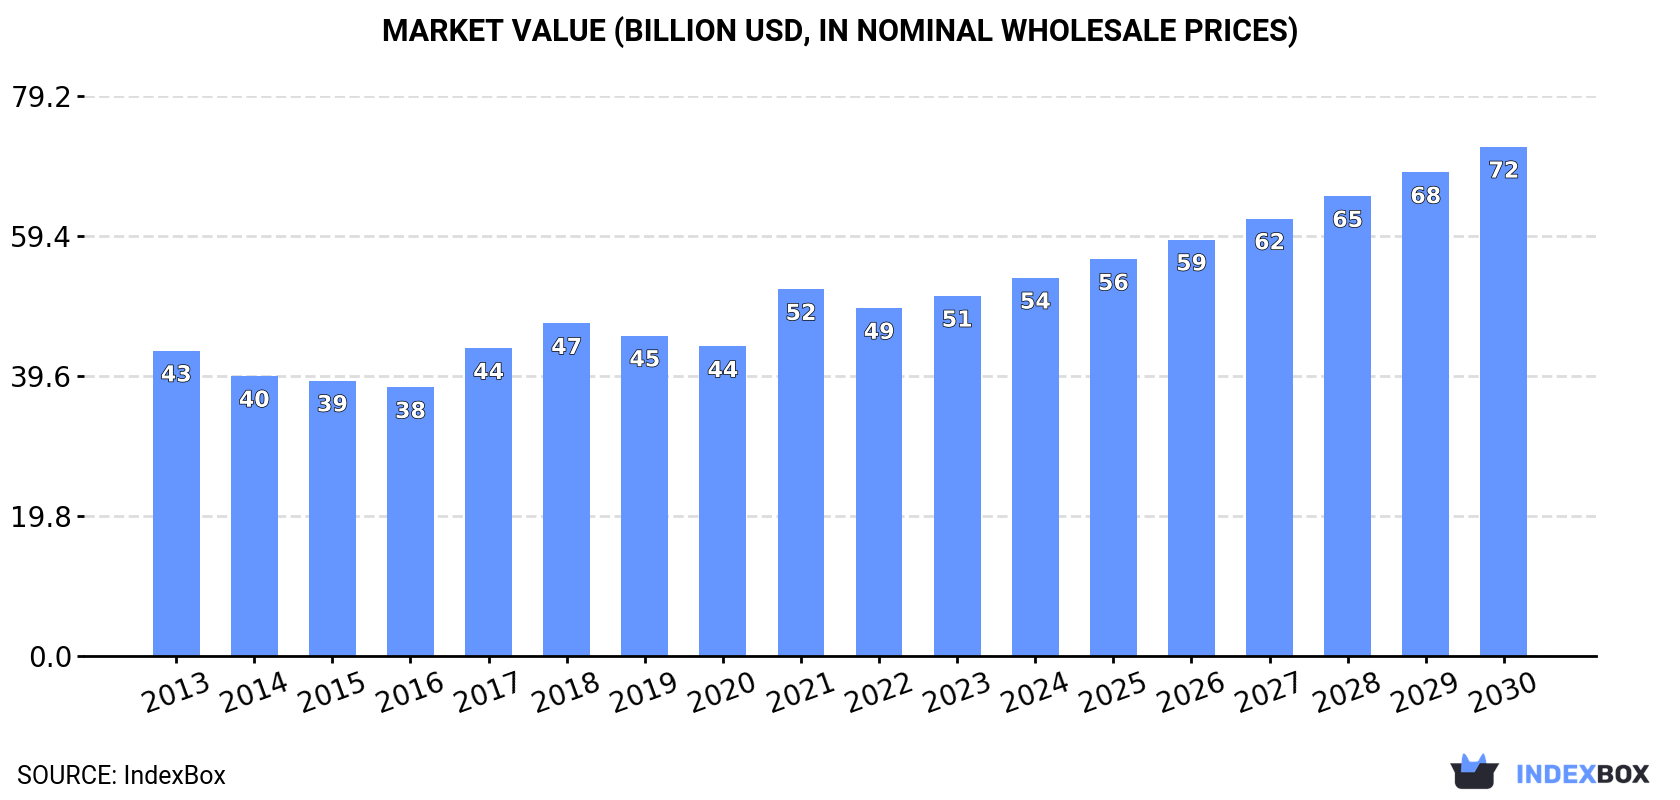
In value terms, the market is forecast to increase with an anticipated CAGR of +5.1% for the period from 2023 to 2030, which is projected to bring the market value to $72B (in in nominal wholesale prices) by the end of 2030.
Consumption
World Consumption of Sunflower Seed
In 2023, the amount of sunflower seed consumed worldwide expanded slightly to 56M tons, with an increase of 4.4% compared with the year before. The total consumption volume increased at an average annual rate of +2.7% over the period from 2013 to 2023; however, the trend pattern indicated some noticeable fluctuations being recorded throughout the analyzed period. As a result, consumption attained the peak volume of 58M tons. From 2022 to 2023, the growth of the global consumption remained at a somewhat lower figure.
The global sunflower seed market revenue expanded slightly to $50.9B in 2023, growing by 3.5% against the previous year. This figure reflects the total revenues of producers and importers (excluding logistics costs, retail marketing costs, and retailers' margins, which will be included in the final consumer price). The market value increased at an average annual rate of +1.7% over the period from 2013 to 2023; however, the trend pattern indicated some noticeable fluctuations being recorded throughout the analyzed period. As a result, consumption attained the peak level of $51.9B. From 2022 to 2023, the growth of the global market remained at a lower figure.
Consumption By Country
The countries with the highest volumes of consumption in 2023 were Russia (16M tons), Ukraine (13M tons) and Argentina (3.6M tons), together comprising 58% of global consumption. Turkey, China, Bulgaria, France, Hungary, Spain, Romania, Tanzania, the United States and Kazakhstan lagged somewhat behind, together comprising a further 29%.
From 2013 to 2023, the biggest increases were recorded for Bulgaria (with a CAGR of +8.4%), while consumption for the other global leaders experienced more modest paces of growth.
In value terms, Russia ($9.3B), Ukraine ($6.4B) and Turkey ($6B) appeared to be the countries with the highest levels of market value in 2023, with a combined 43% share of the global market. Spain, China, Argentina, the United States, France, Bulgaria, Hungary, Tanzania, Romania and Kazakhstan lagged somewhat behind, together comprising a further 37%.
In terms of the main consuming countries, Bulgaria, with a CAGR of +10.1%, saw the highest growth rate of market size over the period under review, while market for the other global leaders experienced more modest paces of growth.
The countries with the highest levels of sunflower seed per capita consumption in 2023 were Ukraine (302 kg per person), Bulgaria (272 kg per person) and Hungary (175 kg per person).
From 2013 to 2023, the biggest increases were recorded for Bulgaria (with a CAGR of +9.1%), while consumption for the other global leaders experienced more modest paces of growth.
Production
World Production of Sunflower Seed
In 2023, approx. 56M tons of sunflower seed were produced worldwide; growing by 3.4% on 2022 figures. The total output volume increased at an average annual rate of +2.6% from 2013 to 2023; however, the trend pattern indicated some noticeable fluctuations being recorded throughout the analyzed period. The most prominent rate of growth was recorded in 2021 with an increase of 16% against the previous year. As a result, production attained the peak volume of 58M tons. From 2022 to 2023, global production growth failed to regain momentum. The general positive trend in terms output was largely conditioned by a temperate increase of the harvested area and mild growth in yield figures.
In value terms, sunflower seed production expanded rapidly to $49B in 2023 estimated in export price. The total output value increased at an average annual rate of +1.2% over the period from 2013 to 2023; however, the trend pattern indicated some noticeable fluctuations being recorded in certain years. The most prominent rate of growth was recorded in 2021 with an increase of 38% against the previous year. As a result, production reached the peak level of $52.6B. From 2022 to 2023, global production growth remained at a lower figure.
Production By Country
The countries with the highest volumes of production in 2023 were Russia (16M tons), Ukraine (14M tons) and Argentina (3.6M tons), together accounting for 60% of global production. China, Turkey, Romania, Bulgaria, France, Hungary, Kazakhstan, Tanzania and the United States lagged somewhat behind, together accounting for a further 30%.
From 2013 to 2023, the most notable rate of growth in terms of production, amongst the leading producing countries, was attained by Kazakhstan (with a CAGR of +7.4%), while production for the other global leaders experienced more modest paces of growth.
Yield
The global average sunflower seed yield amounted to 1.9 tons per ha in 2023, with an increase of 3.1% on the previous year's figure. The yield figure increased at an average annual rate of +1.1% from 2013 to 2023; the trend pattern remained relatively stable, with somewhat noticeable fluctuations in certain years. The pace of growth was the most pronounced in 2021 when the yield increased by 8.2% against the previous year. Over the period under review, the average sunflower seed yield hit record highs at 2.1 tons per ha in 2019; however, from 2020 to 2023, the yield stood at a somewhat lower figure.
Harvested Area
In 2023, approx. 29M ha of sunflower seed were harvested worldwide; almost unchanged from the year before. The harvested area increased at an average annual rate of +1.5% over the period from 2013 to 2023; the trend pattern remained consistent, with only minor fluctuations throughout the analyzed period. The most prominent rate of growth was recorded in 2016 when the harvested area increased by 7.3%. The global harvested area peaked at 29M ha in 2021; however, from 2022 to 2023, the harvested area stood at a somewhat lower figure.
Imports
World Imports of Sunflower Seed
Global sunflower seed imports declined markedly to 6.1M tons in 2023, dropping by -20.5% on 2022. Over the period under review, total imports indicated a notable expansion from 2013 to 2023: its volume increased at an average annual rate of +2.3% over the last decade. The trend pattern, however, indicated some noticeable fluctuations being recorded throughout the analyzed period. Based on 2023 figures, imports increased by +19.0% against 2021 indices. The growth pace was the most rapid in 2022 with an increase of 50%. As a result, imports reached the peak of 7.7M tons, and then shrank sharply in the following year.
In value terms, sunflower seed imports dropped rapidly to $5.8B in 2023. Overall, imports, however, showed a perceptible increase. The most prominent rate of growth was recorded in 2022 with an increase of 49%. As a result, imports attained the peak of $7.5B, and then reduced dramatically in the following year.
Imports By Country
The countries with the highest levels of sunflower seed imports in 2023 were Turkey (746K tons), Bulgaria (658K tons), the Netherlands (653K tons), France (519K tons), Spain (452K tons), Hungary (368K tons), Romania (314K tons), Germany (284K tons), Italy (244K tons), Portugal (197K tons), the Czech Republic (196K tons) and Austria (145K tons), together reaching 78% of total import. Belgium (126K tons) held a relatively small share of total imports.
From 2013 to 2023, the biggest increases were recorded for Bulgaria (with a CAGR of +38.4%), while purchases for the other global leaders experienced more modest paces of growth.
In value terms, Turkey ($481M), France ($474M) and the Netherlands ($438M) constituted the countries with the highest levels of imports in 2023, with a combined 24% share of global imports. Spain, Bulgaria, Romania, Germany, Hungary, Italy, Austria, the Czech Republic, Belgium and Portugal lagged somewhat behind, together comprising a further 42%.
Among the main importing countries, Bulgaria, with a CAGR of +17.7%, saw the highest rates of growth with regard to the value of imports, over the period under review, while purchases for the other global leaders experienced more modest paces of growth.
Import Prices By Country
In 2023, the average sunflower seed import price amounted to $940 per ton, shrinking by -2.5% against the previous year. Over the period from 2013 to 2023, it increased at an average annual rate of +1.0%. The most prominent rate of growth was recorded in 2021 when the average import price increased by 34%. As a result, import price attained the peak level of $973 per ton. From 2022 to 2023, the average import prices remained at a lower figure.
Prices varied noticeably by country of destination: amid the top importers, the country with the highest price was Austria ($1,058 per ton), while Portugal ($563 per ton) was amongst the lowest.
From 2013 to 2023, the most notable rate of growth in terms of prices was attained by Belgium (+4.4%), while the other global leaders experienced more modest paces of growth.
Exports
World Exports of Sunflower Seed
In 2023, the amount of sunflower seed exported worldwide dropped remarkably to 6.2M tons, waning by -25.3% compared with the year before. Over the period under review, total exports indicated mild growth from 2013 to 2023: its volume increased at an average annual rate of +1.3% over the last decade. The trend pattern, however, indicated some noticeable fluctuations being recorded throughout the analyzed period. Based on 2023 figures, exports increased by +23.2% against 2021 indices. The pace of growth was the most pronounced in 2022 when exports increased by 65% against the previous year. As a result, the exports reached the peak of 8.3M tons, and then contracted dramatically in the following year.
In value terms, sunflower seed exports plummeted to $5.4B in 2023. Overall, total exports indicated notable growth from 2013 to 2023: its value increased at an average annual rate of +2.4% over the last decade. The trend pattern, however, indicated some noticeable fluctuations being recorded throughout the analyzed period. Based on 2023 figures, exports increased by +73.1% against 2015 indices. The most prominent rate of growth was recorded in 2022 when exports increased by 43%. As a result, the exports attained the peak of $6.8B, and then reduced notably in the following year.
Exports By Country
In 2023, Romania (1.6M tons), distantly followed by Bulgaria (886K tons), Ukraine (797K tons), France (579K tons) and China (463K tons) were the main exporters of sunflower seed, together comprising 69% of total exports. Moldova (279K tons), Kazakhstan (246K tons), Russia (214K tons), Hungary (201K tons), Slovakia (173K tons) and Croatia (103K tons) held a relatively small share of total exports.
From 2013 to 2023, the biggest increases were recorded for Ukraine (with a CAGR of +27.5%), while shipments for the other global leaders experienced more modest paces of growth.
In value terms, Romania ($938M), China ($828M) and Bulgaria ($787M) constituted the countries with the highest levels of exports in 2023, together comprising 47% of global exports. France, Ukraine, Hungary, Moldova, Kazakhstan, Russia, Slovakia and Croatia lagged somewhat behind, together accounting for a further 29%.
In terms of the main exporting countries, Ukraine, with a CAGR of +18.9%, recorded the highest growth rate of the value of exports, over the period under review, while shipments for the other global leaders experienced more modest paces of growth.
Export Prices By Country
The average sunflower seed export price stood at $870 per ton in 2023, increasing by 6% against the previous year. Over the last decade, it increased at an average annual rate of +1.1%. The most prominent rate of growth was recorded in 2021 when the average export price increased by 38% against the previous year. As a result, the export price reached the peak level of $944 per ton. From 2022 to 2023, the average export prices failed to regain momentum.
There were significant differences in the average prices amongst the major exporting countries. In 2023, amid the top suppliers, the country with the highest price was China ($1,788 per ton), while Ukraine ($348 per ton) was amongst the lowest.
From 2013 to 2023, the most notable rate of growth in terms of prices was attained by Kazakhstan (+3.7%), while the other global leaders experienced more modest paces of growth.
This report provides an in-depth analysis of the global sunflower seed market. Within it, you will discover the latest data on market trends and opportunities by country, consumption, production and price developments, as well as the global trade (imports and exports). The forecast exhibits the market prospects through 2030.
Product coverage:
- FCL 267 - Sunflower seed
Country coverage:
Worldwide - the report contains statistical data for 200 countries and includes detailed profiles of the 50 largest consuming countries:
- USA
- China
- Japan
- Germany
- United Kingdom
- France
- Brazil
- Italy
- Russian Federation
- India
- Canada
- Australia
- Republic of Korea
- Spain
- Mexico
- Indonesia
- Netherlands
- Turkey
- Saudi Arabia
- Switzerland
- Sweden
- Nigeria
- Poland
- Belgium
- Argentina
- Norway
- Austria
- Thailand
- United Arab Emirates
- Colombia
- Denmark
- South Africa
- Malaysia
- Israel
- Singapore
- Egypt
- Philippines
- Finland
- Chile
- Ireland
- Pakistan
- Greece
- Portugal
- Kazakhstan
- Algeria
- Czech Republic
- Qatar
- Peru
- Romania
- Vietnam
+ the largest producing countries
Data coverage:
- Global market volume and value
- Per Capita consumption
- Forecast of the market dynamics in the medium term
- Global production, split by region and country
- Global trade (exports and imports)
- Export and import prices
- Market trends, drivers and restraints
- Key market players and their profiles
Company coverage:
Reasons to buy this report:
- Take advantage of the latest data
- Find deeper insights into current market developments
- Discover vital success factors affecting the market
This report is designed for manufacturers, distributors, importers, and wholesalers, as well as for investors, consultants and advisors.
In this report, you can find information that helps you to make informed decisions on the following issues:
- How to diversify your business and benefit from new market opportunities
- How to load your idle production capacity
- How to boost your sales on overseas markets
- How to increase your profit margins
- How to make your supply chain more sustainable
- How to reduce your production and supply chain costs
- How to outsource production to other countries
- How to prepare your business for global expansion
While doing this research, we combine the accumulated expertise of our analysts and the capabilities of artificial intelligence. The AI-based platform, developed by our data scientists, constitutes the key working tool for business analysts, empowering them to discover deep insights and ideas from the marketing data.
-
1. INTRODUCTION
Making Data-Driven Decisions to Grow Your Business
- REPORT DESCRIPTION
- RESEARCH METHODOLOGY AND AI PLATFORM
- DATA-DRIVEN DECISIONS FOR YOUR BUSINESS
- GLOSSARY AND SPECIFIC TERMS
-
2. EXECUTIVE SUMMARY
A Quick Overview of Market Performance
- KEY FINDINGS
- MARKET TRENDS This Chapter is Available Only for the Professional Edition PRO
-
3. MARKET OVERVIEW
Understanding the Current State of The Market and Its Prospects
- MARKET SIZE
- CONSUMPTION BY COUNTRY
- MARKET FORECAST TO 2030
-
4. MOST PROMISING PRODUCT
Finding New Products to Diversify Your Business
This Chapter is Available Only for the Professional Edition PRO- TOP PRODUCTS TO DIVERSIFY YOUR BUSINESS
- BEST-SELLING PRODUCTS
- MOST CONSUMED PRODUCT
- MOST TRADED PRODUCT
- MOST PROFITABLE PRODUCT FOR EXPORT
-
5. MOST PROMISING SUPPLYING COUNTRIES
Choosing the Best Countries to Establish Your Sustainable Supply Chain
This Chapter is Available Only for the Professional Edition PRO- TOP COUNTRIES TO SOURCE YOUR PRODUCT
- TOP PRODUCING COUNTRIES
- COUNTRIES WITH TOP YIELDS
- TOP EXPORTING COUNTRIES
- LOW-COST EXPORTING COUNTRIES
-
6. MOST PROMISING OVERSEAS MARKETS
Choosing the Best Countries to Boost Your Exports
This Chapter is Available Only for the Professional Edition PRO- TOP OVERSEAS MARKETS FOR EXPORTING YOUR PRODUCT
- TOP CONSUMING MARKETS
- UNSATURATED MARKETS
- TOP IMPORTING MARKETS
- MOST PROFITABLE MARKETS
7. GLOBAL PRODUCTION
The Latest Trends and Insights into The Industry
- PRODUCTION VOLUME AND VALUE
- PRODUCTION BY COUNTRY
- HARVESTED AREA AND YIELD BY COUNTRY
8. GLOBAL IMPORTS
The Largest Importers on The Market and How They Succeed
- IMPORTS FROM 2012–2023
- IMPORTS BY COUNTRY
- IMPORT PRICES BY COUNTRY
9. GLOBAL EXPORTS
The Largest Exporters on The Market and How They Succeed
- EXPORTS FROM 2012–2023
- EXPORTS BY COUNTRY
- EXPORT PRICES BY COUNTRY
-
10. PROFILES OF MAJOR PRODUCERS
The Largest Producers on The Market and Their Profiles
This Chapter is Available Only for the Professional Edition PRO -
11. COUNTRY PROFILES
The Largest Markets And Their Profiles
This Chapter is Available Only for the Professional Edition PRO- United States
- China
- Japan
- Germany
- United Kingdom
- France
- Brazil
- Italy
- Russian Federation
- India
- Canada
- Australia
- Republic of Korea
- Spain
- Mexico
- Indonesia
- Netherlands
- Turkey
- Saudi Arabia
- Switzerland
- Sweden
- Nigeria
- Poland
- Belgium
- Argentina
- Norway
- Austria
- Thailand
- United Arab Emirates
- Colombia
- Denmark
- South Africa
- Malaysia
- Israel
- Singapore
- Egypt
- Philippines
- Finland
- Chile
- Ireland
- Pakistan
- Greece
- Portugal
- Kazakhstan
- Algeria
- Czech Republic
- Qatar
- Peru
- Romania
- Vietnam
-
LIST OF TABLES
- Key Findings In 2023
- Market Volume, In Physical Terms, 2012–2023
- Market Value, 2012–2023
- Per Capita Consumption, By Country, 2018–2023
- Production, In Physical Terms, By Country, 2012–2023
- Harvested Area, By Country, 2012-2023
- Yield, By Country, 2012-2023
- Imports, In Physical Terms, By Country, 2012–2023
- Imports, In Value Terms, By Country, 2012–2023
- Import Prices, By Country Of Destination, 2012–2023
- Exports, In Physical Terms, By Country, 2012–2023
- Exports, In Value Terms, By Country, 2012–2023
- Export Prices, By Country Of Origin, 2012–2023
-
LIST OF FIGURES
- Market Volume, In Physical Terms, 2012–2023
- Market Value, 2012–2023
- Consumption, By Country, 2023
- Market Volume Forecast to 2030
- Market Value Forecast to 2030
- Products: Market Size And Growth, By Type
- Products: Average Per Capita Consumption, By Type
- Products: Exports And Growth, By Type
- Products: Export Prices And Growth, By Type
- Production Volume And Growth
- Yield And Growth
- Exports And Growth
- Export Prices And Growth
- Market Size And Growth
- Per Capita Consumption
- Imports And Growth
- Import Prices
- Production, In Physical Terms, 2012–2023
- Production, In Value Terms, 2012–2023
- Area Harvested, 2012–2023
- Yield, 2012–2023
- Production, By Country, 2023
- Production, In Physical Terms, By Country, 2012–2023
- Harvested Area, By Country, 2023
- Harvested Area, By Country, 2012-2023
- Yield, By Country, 2012-2023
- Imports, In Physical Terms, 2012–2023
- Imports, In Value Terms, 2012–2023
- Imports, In Physical Terms, By Country, 2023
- Imports, In Physical Terms, By Country, 2012–2023
- Imports, In Value Terms, By Country, 2012–2023
- Import Prices, By Country, 2012–2023
- Exports, In Physical Terms, 2012–2023
- Exports, In Value Terms, 2012–2023
- Exports, In Physical Terms, By Country, 2023
- Exports, In Physical Terms, By Country, 2012–2023
- Exports, In Value Terms, By Country, 2012–2023
- Export Prices, 2012–2023


