World - Polycarboxylic Acids - Market Analysis, Forecast, Size, Trends and Insights
Get instant access to more than 2 million reports, dashboards, and datasets on the IndexBox Platform.
View PricingGlobal Polycarboxylic Acids Market to See Steady Growth with a CAGR of +1.8% from 2023 to 2030
IndexBox has just published a new report: World - Polycarboxylic Acids - Market Analysis, Forecast, Size, Trends and Insights.
The global polycarboxylic acid market is on an upward trend, with increasing demand driving growth in consumption and production. Countries like China, the United States, and India are key players in both production and consumption, while Belgium stands out for its significant growth in per capita consumption. Imports and exports are also on the rise, with China leading the way in exports and imports. Prices have shown fluctuations, with some countries experiencing growth while others see declines in export and import prices.
Market Forecast
Driven by increasing demand for polycarboxylic acids worldwide, the market is expected to continue an upward consumption trend over the next seven-year period. Market performance is forecast to decelerate, expanding with an anticipated CAGR of +1.8% for the period from 2023 to 2030, which is projected to bring the market volume to 32M tons by the end of 2030.
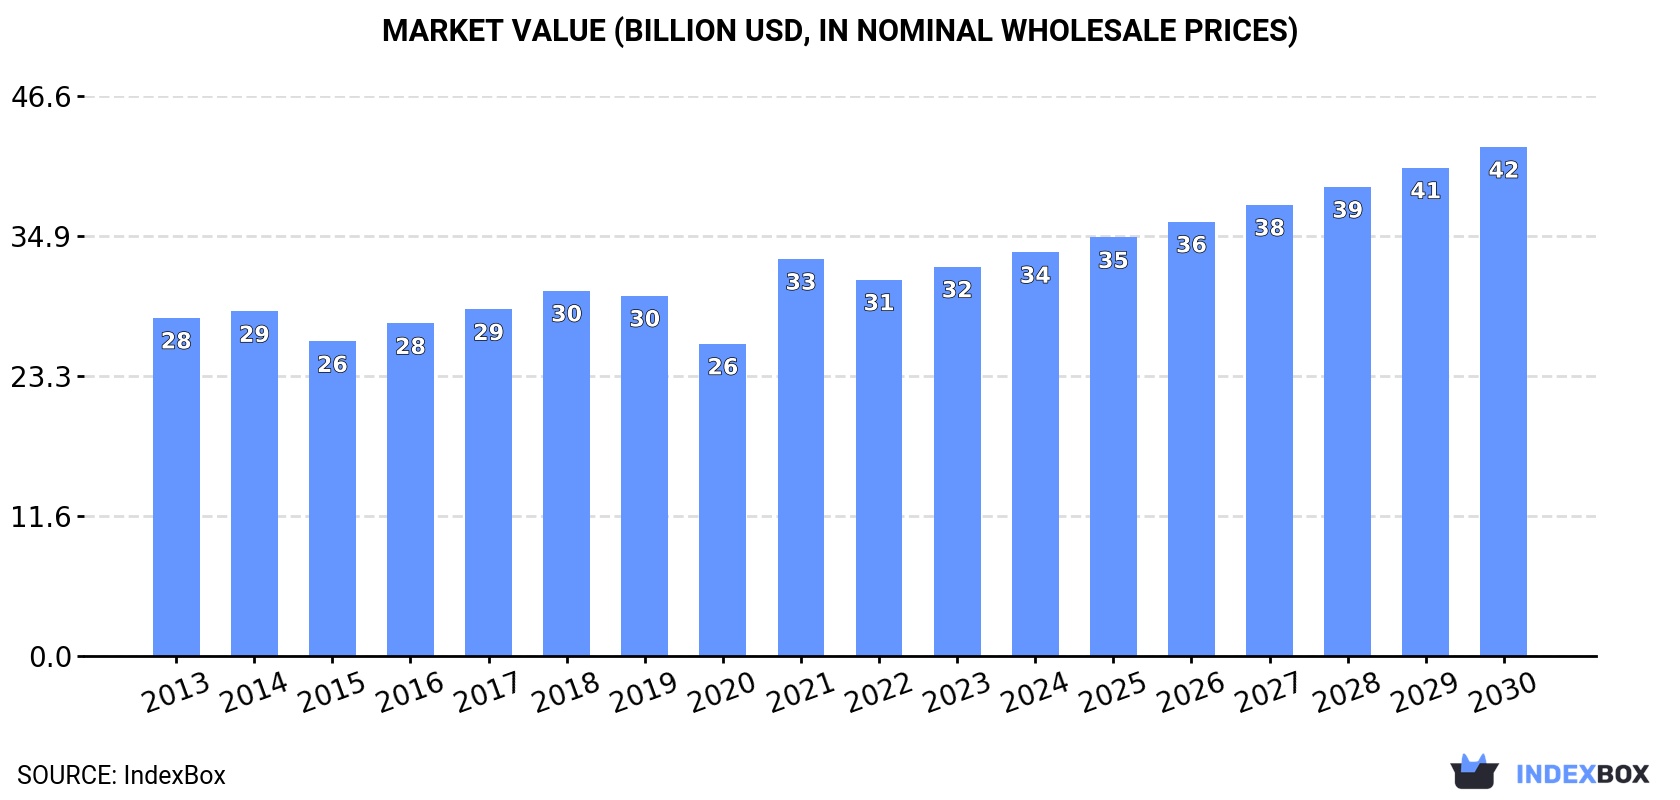
In value terms, the market is forecast to increase with an anticipated CAGR of +3.9% for the period from 2023 to 2030, which is projected to bring the market value to $42.3B (in nominal prices) by the end of 2030.
Consumption
World Consumption of Polycarboxylic Acids
Global polycarboxylic acid consumption rose markedly to 28M tons in 2023, surging by 8.6% against the previous year's figure. The total consumption volume increased at an average annual rate of +3.8% over the period from 2013 to 2023; however, the trend pattern indicated some noticeable fluctuations being recorded throughout the analyzed period. As a result, consumption attained the peak volume of 29M tons. From 2022 to 2023, the growth of the global consumption remained at a somewhat lower figure.
The global polycarboxylic acid market size rose modestly to $32.4B in 2023, growing by 3.4% against the previous year. This figure reflects the total revenues of producers and importers (excluding logistics costs, retail marketing costs, and retailers' margins, which will be included in the final consumer price). The market value increased at an average annual rate of +1.4% from 2013 to 2023; however, the trend pattern remained relatively stable, with only minor fluctuations being observed in certain years. As a result, consumption attained the peak level of $33B. From 2022 to 2023, the growth of the global market remained at a somewhat lower figure.
Consumption By Country
The countries with the highest volumes of consumption in 2023 were the United States (2.7M tons), China (2.6M tons) and India (2.4M tons), with a combined 27% share of global consumption. Turkey, Brazil, Mexico, Vietnam, Germany, Pakistan, Japan, Indonesia, Belgium and the UK lagged somewhat behind, together accounting for a further 40%.
From 2013 to 2023, the biggest increases were recorded for Belgium (with a CAGR of +32.4%), while consumption for the other global leaders experienced more modest paces of growth.
In value terms, the United States ($5B), China ($2.9B) and India ($2.3B) were the countries with the highest levels of market value in 2023, with a combined 32% share of the global market. Turkey, Germany, Japan, Mexico, Belgium, Pakistan, Vietnam, Brazil, Indonesia and the UK lagged somewhat behind, together accounting for a further 33%.
Belgium, with a CAGR of +32.0%, saw the highest rates of growth with regard to market size among the main consuming countries over the period under review, while market for the other global leaders experienced more modest paces of growth.
In 2023, the highest levels of polycarboxylic acid per capita consumption was registered in Belgium (58 kg per person), followed by Turkey (23 kg per person), Mexico (12 kg per person) and Germany (11 kg per person), while the world average per capita consumption of polycarboxylic acid was estimated at 3.5 kg per person.
In Belgium, polycarboxylic acid per capita consumption expanded at an average annual rate of +31.8% over the period from 2013-2023. In the other countries, the average annual rates were as follows: Turkey (+14.7% per year) and Mexico (+3.6% per year).
Production
World Production of Polycarboxylic Acids
In 2023, the amount of polycarboxylic acids produced worldwide rose slightly to 28M tons, picking up by 4.5% compared with the year before. The total output volume increased at an average annual rate of +4.4% from 2013 to 2023; however, the trend pattern indicated some noticeable fluctuations being recorded in certain years. The most prominent rate of growth was recorded in 2021 with an increase of 17%. As a result, production reached the peak volume of 29M tons. From 2022 to 2023, global production growth remained at a somewhat lower figure.
In value terms, polycarboxylic acid production expanded rapidly to $30.2B in 2023 estimated in export price. The total output value increased at an average annual rate of +3.0% from 2013 to 2023; however, the trend pattern indicated some noticeable fluctuations being recorded in certain years. The pace of growth appeared the most rapid in 2021 when the production volume increased by 35% against the previous year. As a result, production attained the peak level of $32B. From 2022 to 2023, global production growth remained at a lower figure.
Production By Country
The country with the largest volume of polycarboxylic acid production was China (7.2M tons), accounting for 26% of total volume. Moreover, polycarboxylic acid production in China exceeded the figures recorded by the second-largest producer, South Korea (2.7M tons), threefold. The United States (2.1M tons) ranked third in terms of total production with a 7.4% share.
In China, polycarboxylic acid production increased at an average annual rate of +41.1% over the period from 2013-2023. The remaining producing countries recorded the following average annual rates of production growth: South Korea (-3.8% per year) and the United States (+2.9% per year).
Imports
World Imports of Polycarboxylic Acids
Global polycarboxylic acid imports expanded to 14M tons in 2023, with an increase of 2.5% on 2022 figures. In general, imports recorded a modest expansion. The most prominent rate of growth was recorded in 2021 with an increase of 14% against the previous year. As a result, imports attained the peak of 14M tons. From 2022 to 2023, the growth of global imports remained at a lower figure.
In value terms, polycarboxylic acid imports contracted to $17.4B in 2023. Over the period under review, imports, however, showed a relatively flat trend pattern. The pace of growth was the most pronounced in 2021 when imports increased by 56%. Global imports peaked at $20.3B in 2022, and then declined in the following year.
Imports By Country
Turkey (2.1M tons) and India (2M tons) represented roughly 29% of total imports in 2023. Vietnam (1,044K tons) took a 7.4% share (based on physical terms) of total imports, which put it in second place, followed by the United States (6.7%). Oman (612K tons), Italy (594K tons), Germany (559K tons), Egypt (498K tons), China (457K tons), Lithuania (446K tons), Spain (383K tons), Russia (362K tons) and the Netherlands (338K tons) held a minor share of total imports.
From 2013 to 2023, the most notable rate of growth in terms of purchases, amongst the main importing countries, was attained by Egypt (with a CAGR of +24.8%), while imports for the other global leaders experienced more modest paces of growth.
In value terms, the largest polycarboxylic acid importing markets worldwide were Turkey ($1.9B), India ($1.8B) and the United States ($1.6B), with a combined 31% share of global imports. Germany, Vietnam, Italy, China, the Netherlands, Egypt, Spain, Oman, Lithuania and Russia lagged somewhat behind, together comprising a further 36%.
Among the main importing countries, Egypt, with a CAGR of +18.8%, recorded the highest rates of growth with regard to the value of imports, over the period under review, while purchases for the other global leaders experienced more modest paces of growth.
Import Prices By Country
The average polycarboxylic acid import price stood at $1,231 per ton in 2023, dropping by -16.6% against the previous year. Over the period under review, the import price continues to indicate a slight decrease. The growth pace was the most rapid in 2021 an increase of 37% against the previous year. Over the period under review, average import prices hit record highs at $1,476 per ton in 2022, and then declined significantly in the following year.
Prices varied noticeably by country of destination: amid the top importers, the country with the highest price was the Netherlands ($1,730 per ton), while Oman ($823 per ton) was amongst the lowest.
From 2013 to 2023, the most notable rate of growth in terms of prices was attained by China (+0.9%), while the other global leaders experienced a decline in the import price figures.
Exports
World Exports of Polycarboxylic Acids
Global polycarboxylic acid exports reduced to 14M tons in 2023, with a decrease of -4.5% on the previous year. Overall, total exports indicated slight growth from 2013 to 2023: its volume increased at an average annual rate of +1.9% over the last decade. The trend pattern, however, indicated some noticeable fluctuations being recorded throughout the analyzed period. Based on 2023 figures, exports decreased by -7.1% against 2021 indices. The pace of growth was the most pronounced in 2021 when exports increased by 25% against the previous year. As a result, the exports reached the peak of 15M tons. From 2022 to 2023, the growth of the global exports failed to regain momentum.
In value terms, polycarboxylic acid exports declined markedly to $16.3B in 2023. In general, exports continue to indicate a relatively flat trend pattern. The pace of growth was the most pronounced in 2021 when exports increased by 63%. Over the period under review, the global exports hit record highs at $19.4B in 2022, and then dropped dramatically in the following year.
Exports By Country
China represented the main exporter of polycarboxylic acids in the world, with the volume of exports reaching 5M tons, which was approx. 36% of total exports in 2023. It was distantly followed by South Korea (2.5M tons), Taiwan (Chinese) (1.4M tons) and Thailand (1.1M tons), together constituting a 35% share of total exports. The Netherlands (512K tons), Belgium (505K tons), Canada (442K tons), Malaysia (323K tons), the United States (322K tons), Poland (278K tons) and Spain (228K tons) held a minor share of total exports.
From 2013 to 2023, average annual rates of growth with regard to polycarboxylic acid exports from China stood at +25.1%. At the same time, Canada (+30.2%), Spain (+26.8%), Malaysia (+5.2%) and Taiwan (Chinese) (+5.2%) displayed positive paces of growth. Moreover, Canada emerged as the fastest-growing exporter exported in the world, with a CAGR of +30.2% from 2013-2023. Thailand and the Netherlands experienced a relatively flat trend pattern. By contrast, South Korea (-4.0%), Poland (-4.7%), the United States (-7.7%) and Belgium (-7.8%) illustrated a downward trend over the same period. From 2013 to 2023, the share of China, Canada and Taiwan (Chinese) increased by +31, +2.9 and +2.7 percentage points, respectively. The shares of the other countries remained relatively stable throughout the analyzed period.
In value terms, the largest polycarboxylic acid supplying countries worldwide were China ($4.9B), South Korea ($2.5B) and Taiwan (Chinese) ($1.5B), together comprising 54% of global exports. Thailand, the Netherlands, the United States, Canada, Belgium, Spain, Malaysia and Poland lagged somewhat behind, together accounting for a further 29%.
In terms of the main exporting countries, Canada, with a CAGR of +25.6%, saw the highest growth rate of the value of exports, over the period under review, while shipments for the other global leaders experienced more modest paces of growth.
Export Prices By Country
The average polycarboxylic acid export price stood at $1,151 per ton in 2023, declining by -12.3% against the previous year. Overall, the export price saw a pronounced slump. The pace of growth was the most pronounced in 2021 when the average export price increased by 31%. Over the period under review, the average export prices hit record highs at $1,404 per ton in 2013; however, from 2014 to 2023, the export prices stood at a somewhat lower figure.
Prices varied noticeably by country of origin: amid the top suppliers, the country with the highest price was the United States ($2,358 per ton), while Thailand ($812 per ton) was amongst the lowest.
From 2013 to 2023, the most notable rate of growth in terms of prices was attained by the United States (+2.0%), while the other global leaders experienced a decline in the export price figures.
This report provides an in-depth analysis of the global polycarboxylic acid market. Within it, you will discover the latest data on market trends and opportunities by country, consumption, production and price developments, as well as the global trade (imports and exports). The forecast exhibits the market prospects through 2030.
Product coverage:
- Prodcom 20143383 - Oxalic, azelaic, malonic, other, cyclanic, cylenic or cycloterpenic polycarboxylic acids, salts
- Prodcom 20143385 - Adipic acid, its salts and esters
- Prodcom 20143387 - Maleic anhydride
- Prodcom 20143410 - Dibutyl and dioctyl orthophthalates
- Prodcom 20143420 - Other esters of orthophthalic acid
- Prodcom 20143430 - Phthalic anhydride, terephthalic acid and its salts
- Prodcom 20143440 - Aromatic polycarboxylic acids, their anhydrides, halides, p eroxides, peroxyacids and their halogenated, sulphonated, n itrated or nitrosated derivatives (excluding esters of orthophthalic acid, phthalic anhydride, terephthalic acid and
Country coverage:
Worldwide - the report contains statistical data for 200 countries and includes detailed profiles of the 50 largest consuming countries:
- USA
- China
- Japan
- Germany
- United Kingdom
- France
- Brazil
- Italy
- Russian Federation
- India
- Canada
- Australia
- Republic of Korea
- Spain
- Mexico
- Indonesia
- Netherlands
- Turkey
- Saudi Arabia
- Switzerland
- Sweden
- Nigeria
- Poland
- Belgium
- Argentina
- Norway
- Austria
- Thailand
- United Arab Emirates
- Colombia
- Denmark
- South Africa
- Malaysia
- Israel
- Singapore
- Egypt
- Philippines
- Finland
- Chile
- Ireland
- Pakistan
- Greece
- Portugal
- Kazakhstan
- Algeria
- Czech Republic
- Qatar
- Peru
- Romania
- Vietnam
+ the largest producing countries
Data coverage:
- Global market volume and value
- Per Capita consumption
- Forecast of the market dynamics in the medium term
- Global production, split by region and country
- Global trade (exports and imports)
- Export and import prices
- Market trends, drivers and restraints
- Key market players and their profiles
Reasons to buy this report:
- Take advantage of the latest data
- Find deeper insights into current market developments
- Discover vital success factors affecting the market
This report is designed for manufacturers, distributors, importers, and wholesalers, as well as for investors, consultants and advisors.
In this report, you can find information that helps you to make informed decisions on the following issues:
- How to diversify your business and benefit from new market opportunities
- How to load your idle production capacity
- How to boost your sales on overseas markets
- How to increase your profit margins
- How to make your supply chain more sustainable
- How to reduce your production and supply chain costs
- How to outsource production to other countries
- How to prepare your business for global expansion
While doing this research, we combine the accumulated expertise of our analysts and the capabilities of artificial intelligence. The AI-based platform, developed by our data scientists, constitutes the key working tool for business analysts, empowering them to discover deep insights and ideas from the marketing data.
-
1. INTRODUCTION
Making Data-Driven Decisions to Grow Your Business
- REPORT DESCRIPTION
- RESEARCH METHODOLOGY AND AI PLATFORM
- DATA-DRIVEN DECISIONS FOR YOUR BUSINESS
- GLOSSARY AND SPECIFIC TERMS
-
2. EXECUTIVE SUMMARY
A Quick Overview of Market Performance
- KEY FINDINGS
- MARKET TRENDS This Chapter is Available Only for the Professional Edition PRO
-
3. MARKET OVERVIEW
Understanding the Current State of The Market and Its Prospects
- MARKET SIZE
- CONSUMPTION BY COUNTRY
- MARKET FORECAST TO 2030
-
4. MOST PROMISING PRODUCT
Finding New Products to Diversify Your Business
This Chapter is Available Only for the Professional Edition PRO- TOP PRODUCTS TO DIVERSIFY YOUR BUSINESS
- BEST-SELLING PRODUCTS
- MOST CONSUMED PRODUCT
- MOST TRADED PRODUCT
- MOST PROFITABLE PRODUCT FOR EXPORT
-
5. MOST PROMISING SUPPLYING COUNTRIES
Choosing the Best Countries to Establish Your Sustainable Supply Chain
This Chapter is Available Only for the Professional Edition PRO- TOP COUNTRIES TO SOURCE YOUR PRODUCT
- TOP PRODUCING COUNTRIES
- TOP EXPORTING COUNTRIES
- LOW-COST EXPORTING COUNTRIES
-
6. MOST PROMISING OVERSEAS MARKETS
Choosing the Best Countries to Boost Your Exports
This Chapter is Available Only for the Professional Edition PRO- TOP OVERSEAS MARKETS FOR EXPORTING YOUR PRODUCT
- TOP CONSUMING MARKETS
- UNSATURATED MARKETS
- TOP IMPORTING MARKETS
- MOST PROFITABLE MARKETS
7. GLOBAL PRODUCTION
The Latest Trends and Insights into The Industry
- PRODUCTION VOLUME AND VALUE
- PRODUCTION BY COUNTRY
8. GLOBAL IMPORTS
The Largest Importers on The Market and How They Succeed
- IMPORTS FROM 2012–2023
- IMPORTS BY COUNTRY
- IMPORT PRICES BY COUNTRY
9. GLOBAL EXPORTS
The Largest Exporters on The Market and How They Succeed
- EXPORTS FROM 2012–2023
- EXPORTS BY COUNTRY
- EXPORT PRICES BY COUNTRY
-
10. PROFILES OF MAJOR PRODUCERS
The Largest Producers on The Market and Their Profiles
This Chapter is Available Only for the Professional Edition PRO -
11. COUNTRY PROFILES
The Largest Markets And Their Profiles
This Chapter is Available Only for the Professional Edition PRO- United States
- China
- Japan
- Germany
- United Kingdom
- France
- Brazil
- Italy
- Russian Federation
- India
- Canada
- Australia
- Republic of Korea
- Spain
- Mexico
- Indonesia
- Netherlands
- Turkey
- Saudi Arabia
- Switzerland
- Sweden
- Nigeria
- Poland
- Belgium
- Argentina
- Norway
- Austria
- Thailand
- United Arab Emirates
- Colombia
- Denmark
- South Africa
- Malaysia
- Israel
- Singapore
- Egypt
- Philippines
- Finland
- Chile
- Ireland
- Pakistan
- Greece
- Portugal
- Kazakhstan
- Algeria
- Czech Republic
- Qatar
- Peru
- Romania
- Vietnam
-
LIST OF TABLES
- Key Findings In 2023
- Market Volume, In Physical Terms, 2012–2023
- Market Value, 2012–2023
- Per Capita Consumption, By Country, 2018–2023
- Production, In Physical Terms, By Country, 2012–2023
- Imports, In Physical Terms, By Country, 2012–2023
- Imports, In Value Terms, By Country, 2012–2023
- Import Prices, By Country Of Destination, 2012–2023
- Exports, In Physical Terms, By Country, 2012–2023
- Exports, In Value Terms, By Country, 2012–2023
- Export Prices, By Country Of Origin, 2012–2023
-
LIST OF FIGURES
- Market Volume, In Physical Terms, 2012–2023
- Market Value, 2012–2023
- Consumption, By Country, 2023
- Market Volume Forecast to 2030
- Market Value Forecast to 2030
- Products: Market Size And Growth, By Type
- Products: Average Per Capita Consumption, By Type
- Products: Exports And Growth, By Type
- Products: Export Prices And Growth, By Type
- Production Volume And Growth
- Exports And Growth
- Export Prices And Growth
- Market Size And Growth
- Per Capita Consumption
- Imports And Growth
- Import Prices
- Production, In Physical Terms, 2012–2023
- Production, In Value Terms, 2012–2023
- Production, By Country, 2023
- Production, In Physical Terms, By Country, 2012–2023
- Imports, In Physical Terms, 2012–2023
- Imports, In Value Terms, 2012–2023
- Imports, In Physical Terms, By Country, 2023
- Imports, In Physical Terms, By Country, 2012–2023
- Imports, In Value Terms, By Country, 2012–2023
- Import Prices, By Country, 2012–2023
- Exports, In Physical Terms, 2012–2023
- Exports, In Value Terms, 2012–2023
- Exports, In Physical Terms, By Country, 2023
- Exports, In Physical Terms, By Country, 2012–2023
- Exports, In Value Terms, By Country, 2012–2023
- Export Prices, 2012–2023


