
India - Frozen Fish - Market Analysis, Forecast, Size, Trends and Insights
Get instant access to more than 2 million reports, dashboards, and datasets on the IndexBox Platform.
View PricingIndia's Frozen Fish Export Plummeted to $20M in October 2023
India Frozen Fish Exports
In October 2023, shipments abroad of frozen fish decreased by -82.4% to 11K tons for the first time since July 2023, thus ending a two-month rising trend. Overall, exports showed a abrupt downturn. The pace of growth was the most pronounced in September 2023 with an increase of 150% month-to-month.
In value terms, frozen fish exports declined dramatically to $20M (IndexBox estimates) in October 2023. Over the period under review, exports saw a deep contraction. The growth pace was the most rapid in September 2023 when exports increased by 143% against the previous month.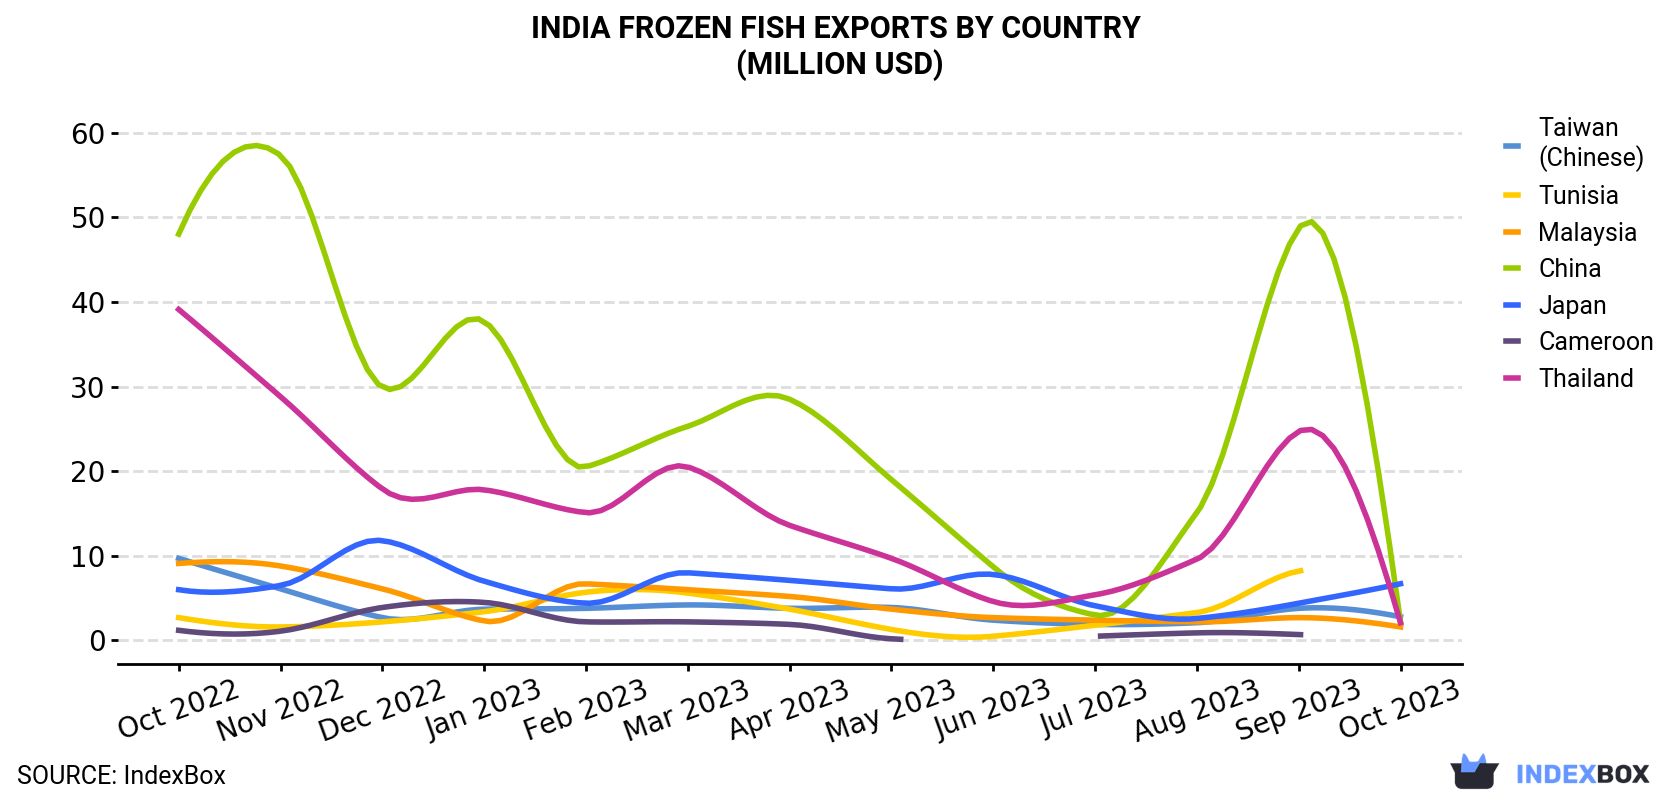
| COUNTRY | Export Value of Frozen Fish in India (million USD) | ||||||||||||
|---|---|---|---|---|---|---|---|---|---|---|---|---|---|
| Oct 2022 | Nov 2022 | Dec 2022 | Jan 2023 | Feb 2023 | Mar 2023 | Apr 2023 | May 2023 | Jun 2023 | Jul 2023 | Aug 2023 | Sep 2023 | Oct 2023 | |
| Japan | 6.0 | 6.5 | 11.8 | 7.0 | 4.4 | 8.0 | 7.1 | 6.1 | 7.8 | 4.1 | 2.6 | 4.4 | 6.7 |
| Taiwan (Chinese) | 9.7 | 6.1 | 2.7 | 3.7 | 3.8 | 4.2 | 3.8 | 3.9 | 2.4 | 1.9 | 2.1 | 3.8 | 2.8 |
| China | 48.0 | 57.3 | 29.9 | 37.7 | 20.5 | 25.3 | 28.5 | 19.0 | 8.7 | 3.0 | 15.1 | 48.7 | 2.2 |
| Thailand | 39.1 | 28.8 | 17.9 | 17.8 | 15.1 | 20.5 | 13.6 | 9.7 | 4.6 | 5.4 | 9.6 | 24.7 | 2.1 |
| Malaysia | 9.1 | 8.8 | 6.1 | 2.3 | 6.7 | 6.0 | 5.2 | 3.7 | 2.7 | 2.4 | 2.2 | 2.7 | 1.6 |
| Tunisia | 2.7 | 1.6 | 2.2 | 3.4 | 5.7 | 5.6 | 3.7 | 1.3 | 0.5 | 1.8 | 3.3 | 8.2 | N/A |
| Cameroon | 1.2 | 1.1 | 3.9 | 4.5 | 2.2 | 2.2 | 1.9 | 0.2 | < 0.1 | 0.5 | 0.9 | 0.7 | N/A |
| Others | 20.9 | 25.7 | 19.5 | 19.5 | 22.0 | 24.1 | 19.2 | 16.4 | 11.1 | 11.1 | 10.3 | 19.2 | 4.8 |
| Total | 137 | 136 | 94.0 | 95.8 | 80.4 | 95.8 | 83.1 | 60.2 | 37.8 | 30.3 | 46.2 | 112 | 20.2 |
Exports by Country
Japan (4K tons) was the main destination for frozen fish exports from India, accounting for a 37% share of total exports. Moreover, frozen fish exports to Japan exceeded the volume sent to the second major destination, Taiwan (Chinese) (1.5K tons), threefold. Thailand (1.1K tons) ranked third in terms of total exports with an 11% share.
From October 2022 to October 2023, the average monthly rate of growth in terms of volume to Japan stood at +2.7%. Exports to the other major destinations recorded the following average monthly rates of exports growth: Taiwan (Chinese) (-3.7% per month) and Thailand (-23.9% per month).
In value terms, Japan ($6.7M) emerged as the key foreign market for frozen fish exports from India, comprising 33% of total exports. The second position in the ranking was taken by Taiwan (Chinese) ($2.8M), with a 14% share of total exports. It was followed by China, with an 11% share.
From October 2022 to October 2023, the average monthly rate of growth in terms of value to Japan was relatively modest. Exports to the other major destinations recorded the following average monthly rates of exports growth: Taiwan (Chinese) (-9.8% per month) and China (-22.5% per month).
Exports by Type
Frozen fish meat (11K tons) was the largest type of frozen fish exported from India, accounting for a approximately 100% share of total exports.
From October 2022 to October 2023, the average monthly rate of growth in terms of the volume of export of frozen fish meat was relatively modest.
In value terms, frozen fish meat ($20M) emerged as the largest type of frozen fish exported from India.
From October 2022 to October 2023, the average monthly rate of growth in terms of the export volume of frozen fish meat amounted to -2.3%.
Export Prices by Country
In October 2023, the frozen fish price stood at $1,880 per ton (FOB, India), growing by 2.4% against the previous month. In general, the export price saw a relatively flat trend pattern. The growth pace was the most rapid in June 2023 an increase of 7.7% m-o-m. As a result, the export price attained the peak level of $1,998 per ton. From July 2023 to October 2023, the the average export prices remained at a somewhat lower figure.
Average prices varied somewhat for the major external markets. In October 2023, the countries with the highest prices were China ($2,296 per ton) and Malaysia ($1,987 per ton), while the average price for exports to Japan ($1,679 per ton) and Lithuania ($1,841 per ton) were amongst the lowest.
From October 2022 to October 2023, the most notable rate of growth in terms of prices was recorded for supplies to Thailand (+3.1%), while the prices for the other major destinations experienced more modest paces of growth.
This report provides an in-depth analysis of the frozen fish market in India. Within it, you will discover the latest data on market trends and opportunities by country, consumption, production and price developments, as well as the global trade (imports and exports). The forecast exhibits the market prospects through 2030.
Product coverage:
- Prodcom 10201330 - Frozen whole salt water fish
- Prodcom 10201360 - Frozen whole fresh water fish
- Prodcom 10201400 - Frozen fish fillets
- Prodcom 10201500 - Frozen fish meat without bones (excluding fillets)
- Prodcom 10201600 - Frozen fish livers and roes
Country coverage:
- India
Data coverage:
- Market volume and value
- Per Capita consumption
- Forecast of the market dynamics in the medium term
- Trade (exports and imports) in India
- Export and import prices
- Market trends, drivers and restraints
- Key market players and their profiles
Reasons to buy this report:
- Take advantage of the latest data
- Find deeper insights into current market developments
- Discover vital success factors affecting the market
This report is designed for manufacturers, distributors, importers, and wholesalers, as well as for investors, consultants and advisors.
In this report, you can find information that helps you to make informed decisions on the following issues:
- How to diversify your business and benefit from new market opportunities
- How to load your idle production capacity
- How to boost your sales on overseas markets
- How to increase your profit margins
- How to make your supply chain more sustainable
- How to reduce your production and supply chain costs
- How to outsource production to other countries
- How to prepare your business for global expansion
While doing this research, we combine the accumulated expertise of our analysts and the capabilities of artificial intelligence. The AI-based platform, developed by our data scientists, constitutes the key working tool for business analysts, empowering them to discover deep insights and ideas from the marketing data.
-
1. INTRODUCTION
Making Data-Driven Decisions to Grow Your Business
- REPORT DESCRIPTION
- RESEARCH METHODOLOGY AND AI PLATFORM
- DATA-DRIVEN DECISIONS FOR YOUR BUSINESS
- GLOSSARY AND SPECIFIC TERMS
-
2. EXECUTIVE SUMMARY
A Quick Overview of Market Performance
- KEY FINDINGS
- MARKET TRENDS This Chapter is Available Only for the Professional Edition PRO
-
3. MARKET OVERVIEW
Understanding the Current State of The Market and Its Prospects
- MARKET SIZE
- MARKET STRUCTURE
- TRADE BALANCE
- PER CAPITA CONSUMPTION
- MARKET FORECAST TO 2030
-
4. MOST PROMISING PRODUCT
Finding New Products to Diversify Your Business
This Chapter is Available Only for the Professional Edition PRO- TOP PRODUCTS TO DIVERSIFY YOUR BUSINESS
- BEST-SELLING PRODUCTS
- MOST CONSUMED PRODUCT
- MOST TRADED PRODUCT
- MOST PROFITABLE PRODUCT FOR EXPORT
-
5. MOST PROMISING SUPPLYING COUNTRIES
Choosing the Best Countries to Establish Your Sustainable Supply Chain
This Chapter is Available Only for the Professional Edition PRO- TOP COUNTRIES TO SOURCE YOUR PRODUCT
- TOP PRODUCING COUNTRIES
- TOP EXPORTING COUNTRIES
- LOW-COST EXPORTING COUNTRIES
-
6. MOST PROMISING OVERSEAS MARKETS
Choosing the Best Countries to Boost Your Exports
This Chapter is Available Only for the Professional Edition PRO- TOP OVERSEAS MARKETS FOR EXPORTING YOUR PRODUCT
- TOP CONSUMING MARKETS
- UNSATURATED MARKETS
- TOP IMPORTING MARKETS
- MOST PROFITABLE MARKETS
7. PRODUCTION
The Latest Trends and Insights into The Industry
- PRODUCTION VOLUME AND VALUE
8. IMPORTS
The Largest Import Supplying Countries
- IMPORTS FROM 2012–2023
- IMPORTS BY COUNTRY
- IMPORT PRICES BY COUNTRY
9. EXPORTS
The Largest Destinations for Exports
- EXPORTS FROM 2012–2023
- EXPORTS BY COUNTRY
- EXPORT PRICES BY COUNTRY
-
10. PROFILES OF MAJOR PRODUCERS
The Largest Producers on The Market and Their Profiles
This Chapter is Available Only for the Professional Edition PRO -
LIST OF TABLES
- Key Findings In 2023
- Market Volume, In Physical Terms, 2012–2023
- Market Value, 2012–2023
- Per Capita Consumption In 2012-2023
- Imports, In Physical Terms, By Country, 2012–2023
- Imports, In Value Terms, By Country, 2012–2023
- Import Prices, By Country Of Origin, 2012–2023
- Exports, In Physical Terms, By Country, 2012–2023
- Exports, In Value Terms, By Country, 2012–2023
- Export Prices, By Country Of Destination, 2012–2023
-
LIST OF FIGURES
- Market Volume, In Physical Terms, 2012–2023
- Market Value, 2012–2023
- Market Structure – Domestic Supply vs. Imports, In Physical Terms, 2012-2023
- Market Structure – Domestic Supply vs. Imports, In Value Terms, 2012-2023
- Trade Balance, In Physical Terms, 2012-2023
- Trade Balance, In Value Terms, 2012-2023
- Per Capita Consumption, 2012-2023
- Market Volume Forecast to 2030
- Market Value Forecast to 2030
- Products: Market Size And Growth, By Type
- Products: Average Per Capita Consumption, By Type
- Products: Exports And Growth, By Type
- Products: Export Prices And Growth, By Type
- Production Volume And Growth
- Exports And Growth
- Export Prices And Growth
- Market Size And Growth
- Per Capita Consumption
- Imports And Growth
- Import Prices
- Production, In Physical Terms, 2012–2023
- Production, In Value Terms, 2012–2023
- Imports, In Physical Terms, 2012–2023
- Imports, In Value Terms, 2012–2023
- Imports, In Physical Terms, By Country, 2023
- Imports, In Physical Terms, By Country, 2012–2023
- Imports, In Value Terms, By Country, 2012–2023
- Import Prices, By Country Of Origin, 2012–2023
- Exports, In Physical Terms, 2012–2023
- Exports, In Value Terms, 2012–2023
- Exports, In Physical Terms, By Country, 2023
- Exports, In Physical Terms, By Country, 2012–2023
- Exports, In Value Terms, By Country, 2012–2023
- Export Prices, By Country Of Destination, 2012–2023


