
France - Mowers - Market Analysis, Forecast, Size, Trends and Insights
Get instant access to more than 2 million reports, dashboards, and datasets on the IndexBox Platform.
View PricingFrances' Import Value Dips to $710M in 2023
France Mower Imports
In 2023, overseas purchases of mowers decreased by -42.4% to 1.3M units, falling for the second year in a row after two years of growth. Over the period under review, imports recorded a pronounced setback. The pace of growth was the most pronounced in 2021 with an increase of 30% against the previous year. As a result, imports reached the peak of 2.3M units. From 2022 to 2023, the growth of imports remained at a lower figure.
In value terms, mower imports contracted to $710M (IndexBox estimates) in 2023. In general, imports saw a relatively flat trend pattern. The most prominent rate of growth was recorded in 2021 when imports increased by 27% against the previous year. Imports peaked at $834M in 2022, and then dropped in the following year.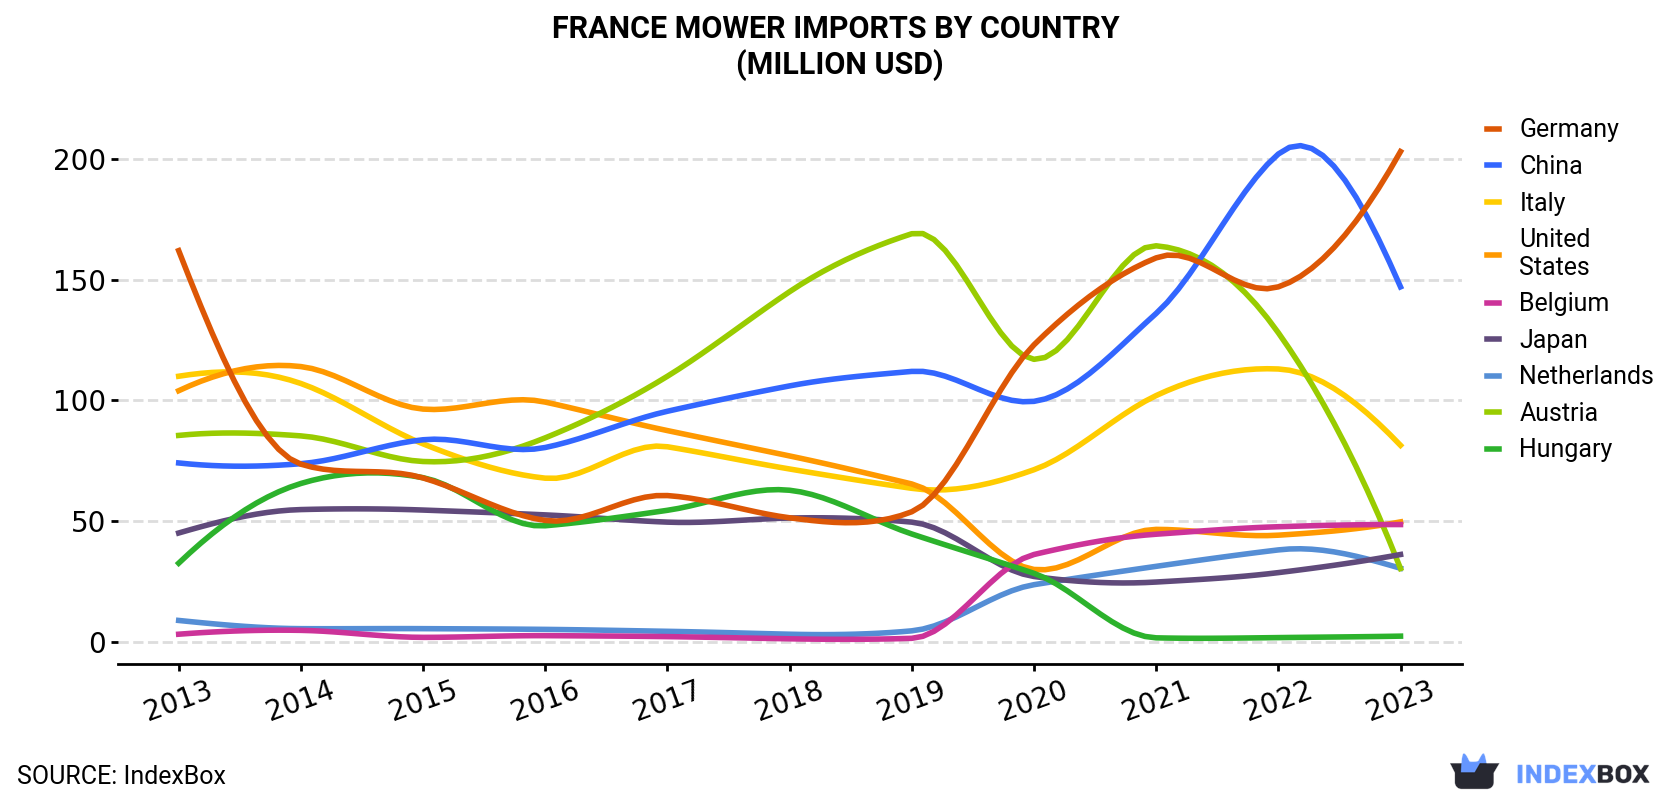
| COUNTRY | Import Value of Mower in France (million USD) | ||||||||||
|---|---|---|---|---|---|---|---|---|---|---|---|
| 2013 | 2014 | 2015 | 2016 | 2017 | 2018 | 2019 | 2020 | 2021 | 2022 | 2023 | |
| Germany | 162 | 73.6 | 67.9 | 50.3 | 60.6 | 51.4 | 53.9 | 123 | 159 | 147 | 203 |
| China | 74.1 | 73.8 | 83.7 | 80.5 | 95.5 | 106 | 112 | 99.6 | 136 | 202 | 147 |
| Italy | 110 | 107 | 82.0 | 67.8 | 80.8 | 71.6 | 63.6 | 71.3 | 102 | 113 | 81.4 |
| United States | 104 | 114 | 96.4 | 99.3 | 87.5 | 77.0 | 65.4 | 30.0 | 46.6 | 44.2 | 49.7 |
| Belgium | 3.2 | 4.8 | 1.9 | 2.6 | 2.2 | 1.3 | 1.5 | 36.2 | 44.6 | 47.7 | 48.6 |
| Japan | 45.1 | 54.8 | 54.6 | 52.6 | 49.6 | 51.3 | 49.6 | 27.1 | 24.8 | 28.7 | 36.2 |
| Netherlands | 8.9 | 5.5 | 5.5 | 5.2 | 4.4 | 3.2 | 4.6 | 23.7 | 31.3 | 38.1 | 30.5 |
| Austria | 85.5 | 85.3 | 74.7 | 84.5 | 110 | 145 | 169 | 117 | 164 | 128 | 30.4 |
| Hungary | 32.6 | 65.6 | 68.0 | 48.1 | 54.5 | 62.8 | 44.7 | 28.4 | 1.7 | 1.8 | 2.4 |
| Others | 98.5 | 106 | 67.8 | 102 | 102 | 124 | 121 | 41.8 | 49.8 | 83.4 | 81.0 |
| Total | 724 | 690 | 602 | 593 | 647 | 693 | 686 | 598 | 760 | 834 | 710 |
Imports by Country
China (464K units), Germany (278K units) and the Netherlands (122K units) were the main suppliers of mower imports to France, with a combined 67% share of total imports. Italy, Belgium, Austria, Hungary, the United States and Japan lagged somewhat behind, together comprising a further 22%.
From 2013 to 2023, the biggest increases were recorded for Belgium (with a CAGR of +31.2%), while purchases for the other leaders experienced more modest paces of growth.
In value terms, Germany ($203M), China ($147M) and Italy ($81M) were the largest mower suppliers to France, together comprising 61% of total imports. the United States, Belgium, Japan, the Netherlands, Austria and Hungary lagged somewhat behind, together accounting for a further 28%.
Among the main suppliers, Belgium, with a CAGR of +31.3%, recorded the highest rates of growth with regard to the value of imports, over the period under review, while purchases for the other leaders experienced more modest paces of growth.
Imports by Type
In 2023, mowers for lawns, parks, golf courses or sports grounds (1.3M units) was the main type of mowers supplied to France, accounting for a 97% share of total imports. It was followed by non-lawn mowers and cutter bars (34K units), with a 2.6% share of total imports.
From 2013 to 2023, the average annual growth rate of the volume of mowers for lawns, parks, golf courses or sports grounds imports totaled -2.2%.
In value terms, mowers for lawns, parks, golf courses or sports grounds ($586M) constituted the largest type of mowers supplied to France, comprising 82% of total imports. The second position in the ranking was held by non-lawn mowers and cutter bars ($125M), with an 18% share of total imports.
Import Prices by Country
In 2023, the mower price amounted to $549 per unit (CIF, France), growing by 48% against the previous year. Over the period under review, import price indicated tangible growth from 2013 to 2023: its price increased at an average annual rate of +3.0% over the last decade. The trend pattern, however, indicated some noticeable fluctuations being recorded throughout the analyzed period. Based on 2023 figures, mower import price increased by +68.4% against 2021 indices. As a result, import price attained the peak level and is likely to continue growth in the immediate term.
Prices varied noticeably by country of origin: amid the top importers, the country with the highest price was Japan ($3,702 per unit), while the price for Hungary ($134 per unit) was amongst the lowest.
From 2013 to 2023, the most notable rate of growth in terms of prices was attained by the United States (+21.1%), while the prices for the other major suppliers experienced more modest paces of growth.
This report provides an in-depth analysis of the mower market in France. Within it, you will discover the latest data on market trends and opportunities by country, consumption, production and price developments, as well as the global trade (imports and exports). The forecast exhibits the market prospects through 2030.
Product coverage:
- Prodcom 28304010 - Electric mowers for lawns, parks, golf courses or sports grounds
- Prodcom 28304030 - Mowers for lawns, parks or sports grounds, powered nonelectrically, w ith the cutting device rotating in a horizontal plane
- Prodcom 28304050 - Motor mowers for lawns, parks or sports grounds, powered non-electrically, with the cutting device rotating in a vertical plane or with cutter bars
- Prodcom 28304070 - Non-motorised mowers for lawns, parks, golf courses or sports grounds (such as push cylinder mowers) (excluding with the cutting device rotating in a horizontal plane)
- Prodcom 28305130 - Motor mowers (excluding for lawns, parks, golf courses or sports grounds)
- Prodcom 28305153 -
- Prodcom 28305155 -
- Prodcom 28305150 - Mowers, including cutter bars, designed to be carried on or hauled by a tractor
- Prodcom 28305170 - Mowers (excluding those with motors, for lawns, parks, golf courses or sports grounds, those designed to be hauled or carried by a tractor)
Country coverage:
- France
Data coverage:
- Market volume and value
- Per Capita consumption
- Forecast of the market dynamics in the medium term
- Trade (exports and imports) in France
- Export and import prices
- Market trends, drivers and restraints
- Key market players and their profiles
Reasons to buy this report:
- Take advantage of the latest data
- Find deeper insights into current market developments
- Discover vital success factors affecting the market
This report is designed for manufacturers, distributors, importers, and wholesalers, as well as for investors, consultants and advisors.
In this report, you can find information that helps you to make informed decisions on the following issues:
- How to diversify your business and benefit from new market opportunities
- How to load your idle production capacity
- How to boost your sales on overseas markets
- How to increase your profit margins
- How to make your supply chain more sustainable
- How to reduce your production and supply chain costs
- How to outsource production to other countries
- How to prepare your business for global expansion
While doing this research, we combine the accumulated expertise of our analysts and the capabilities of artificial intelligence. The AI-based platform, developed by our data scientists, constitutes the key working tool for business analysts, empowering them to discover deep insights and ideas from the marketing data.
-
1. INTRODUCTION
Making Data-Driven Decisions to Grow Your Business
- REPORT DESCRIPTION
- RESEARCH METHODOLOGY AND AI PLATFORM
- DATA-DRIVEN DECISIONS FOR YOUR BUSINESS
- GLOSSARY AND SPECIFIC TERMS
-
2. EXECUTIVE SUMMARY
A Quick Overview of Market Performance
- KEY FINDINGS
- MARKET TRENDS This Chapter is Available Only for the Professional Edition PRO
-
3. MARKET OVERVIEW
Understanding the Current State of The Market and Its Prospects
- MARKET SIZE
- MARKET STRUCTURE
- TRADE BALANCE
- PER CAPITA CONSUMPTION
- MARKET FORECAST TO 2030
-
4. MOST PROMISING PRODUCT
Finding New Products to Diversify Your Business
This Chapter is Available Only for the Professional Edition PRO- TOP PRODUCTS TO DIVERSIFY YOUR BUSINESS
- BEST-SELLING PRODUCTS
- MOST CONSUMED PRODUCT
- MOST TRADED PRODUCT
- MOST PROFITABLE PRODUCT FOR EXPORT
-
5. MOST PROMISING SUPPLYING COUNTRIES
Choosing the Best Countries to Establish Your Sustainable Supply Chain
This Chapter is Available Only for the Professional Edition PRO- TOP COUNTRIES TO SOURCE YOUR PRODUCT
- TOP PRODUCING COUNTRIES
- TOP EXPORTING COUNTRIES
- LOW-COST EXPORTING COUNTRIES
-
6. MOST PROMISING OVERSEAS MARKETS
Choosing the Best Countries to Boost Your Exports
This Chapter is Available Only for the Professional Edition PRO- TOP OVERSEAS MARKETS FOR EXPORTING YOUR PRODUCT
- TOP CONSUMING MARKETS
- UNSATURATED MARKETS
- TOP IMPORTING MARKETS
- MOST PROFITABLE MARKETS
7. PRODUCTION
The Latest Trends and Insights into The Industry
- PRODUCTION VOLUME AND VALUE
8. IMPORTS
The Largest Import Supplying Countries
- IMPORTS FROM 2012–2023
- IMPORTS BY COUNTRY
- IMPORT PRICES BY COUNTRY
9. EXPORTS
The Largest Destinations for Exports
- EXPORTS FROM 2012–2023
- EXPORTS BY COUNTRY
- EXPORT PRICES BY COUNTRY
-
10. PROFILES OF MAJOR PRODUCERS
The Largest Producers on The Market and Their Profiles
This Chapter is Available Only for the Professional Edition PRO -
LIST OF TABLES
- Key Findings In 2023
- Market Volume, In Physical Terms, 2012–2023
- Market Value, 2012–2023
- Per Capita Consumption In 2012-2023
- Imports, In Physical Terms, By Country, 2012–2023
- Imports, In Value Terms, By Country, 2012–2023
- Import Prices, By Country Of Origin, 2012–2023
- Exports, In Physical Terms, By Country, 2012–2023
- Exports, In Value Terms, By Country, 2012–2023
- Export Prices, By Country Of Destination, 2012–2023
-
LIST OF FIGURES
- Market Volume, In Physical Terms, 2012–2023
- Market Value, 2012–2023
- Market Structure – Domestic Supply vs. Imports, In Physical Terms, 2012-2023
- Market Structure – Domestic Supply vs. Imports, In Value Terms, 2012-2023
- Trade Balance, In Physical Terms, 2012-2023
- Trade Balance, In Value Terms, 2012-2023
- Per Capita Consumption, 2012-2023
- Market Volume Forecast to 2030
- Market Value Forecast to 2030
- Products: Market Size And Growth, By Type
- Products: Average Per Capita Consumption, By Type
- Products: Exports And Growth, By Type
- Products: Export Prices And Growth, By Type
- Production Volume And Growth
- Exports And Growth
- Export Prices And Growth
- Market Size And Growth
- Per Capita Consumption
- Imports And Growth
- Import Prices
- Production, In Physical Terms, 2012–2023
- Production, In Value Terms, 2012–2023
- Imports, In Physical Terms, 2012–2023
- Imports, In Value Terms, 2012–2023
- Imports, In Physical Terms, By Country, 2023
- Imports, In Physical Terms, By Country, 2012–2023
- Imports, In Value Terms, By Country, 2012–2023
- Import Prices, By Country Of Origin, 2012–2023
- Exports, In Physical Terms, 2012–2023
- Exports, In Value Terms, 2012–2023
- Exports, In Physical Terms, By Country, 2023
- Exports, In Physical Terms, By Country, 2012–2023
- Exports, In Value Terms, By Country, 2012–2023
- Export Prices, By Country Of Destination, 2012–2023


